Download
1 / 26
260 likes | 332 Views
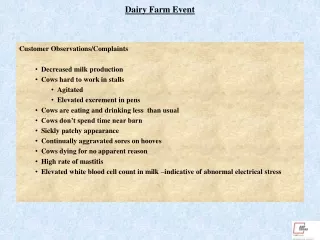
This study explores integrating land cover data with farm statistics to allocate dairy systems in Europe. Comparing CORINE land cover with national data for more accurate results reveals insights into agricultural landscapes.

E N D
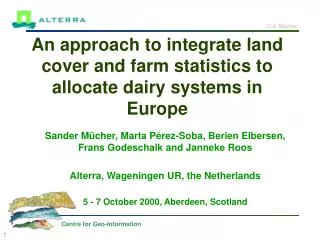
An approach to integrate land cover and farm statistics to allocate dairy systems in Europe Sander Mücher, Marta Pérez-Soba, Berien Elbersen, Frans Godeschalk and Janneke Roos Alterra, Wageningen UR, the Netherlands 5 - 7 October 2000, Aberdeen, Scotland Centre for Geo-Information
Content • Land Use Statistics per Farm type - (FSS) • CORINE land cover versus National land cover • Integrative approach , example NL • Method 1 Using CORINE and FSS-2 (broad) • Method 2 Using National LC and statistics (detailed) • Conclusions Centre for Geo-Information
FSS the Netherlands, 1997 Centre for Geo-Information
FSS GREECE, 1997 Centre for Geo-Information
FSS FINLAND, 1997 Centre for Geo-Information
FSS-1, ‘Noord-Nederland Centre for Geo-Information
FSS-1, ‘Zuid-Nederland’ Centre for Geo-Information
CORINE versus National Land Cover Data Centre for Geo-Information
Land Cover Data Sources CORINE LGN-3 100 m raster, 44 classes Visual interpretation TM/Spot scale: 1 : 100.000 25 m raster,25 classes Automatic classification TM scale: 1 : 25.000 Centre for Geo-Information
Details of LGN and CORINE Centre for Geo-Information
CORINE LGN-3 Centre for Geo-Information
Method 1 - Area Index Dairy Centre for Geo-Information
CORINE NL - 7 classes Pastures Annual/Permanent crops Complex cultivation pattern Land principally occupied by agr. Agro-forestry Natural Grasslands Moors and Heathlands Centre for Geo-Information
Result - Method 1 63 0 % 63 45 47 63 54 54 < 30 51 39 26 38 40 - 50 29 > 60 % Centre for Geo-Information
LGN-3 Grass and Maize Grassland Maize Centre for Geo-Information
Result - Method 2, Grass 72 63 56 50 43 62 63 57 51 24 44 32 Centre for Geo-Information
Result - Method 2, Maize 99 73 90 64 90 63 66 74 51 49 53 44 Centre for Geo-Information
Area Index Grass - Method 2 Grassland ‘Meitelling’ is the total area of grassland used by dairy (4.1) Centre for Geo-Information
Area Index Maize - Method 2 Fodder ‘Meitelling’ is assumed to be maize in LGN-3 Centre for Geo-Information
Comparison Methods COR7 + FSS-2 (1990), Dairy LGN-3 ( Mais+ Grass) + Meitelling 63 73 0 % 63 63 47 52 45 57 63 48 54 < 30 62 54 63 51 57 39 51 26 28 38 40-50 47 29 35 > 60 % Centre for Geo-Information
Comparison Indexes Centre for Geo-Information
Conclusions • Land use statistics per farmtype are a very useful source as expert knowledge, however, • Land Use statistics are difficult to relate to CORINE land cover classes • CORINE land cover classes are informational at the landscape level but not at the field level Centre for Geo-Information
Conclusions • CORINE land cover classes are in fact very heterogeneous at the field level. • Surprisingly, the integration of CORINE with FSS-2 (Method 1) give similar results as the integration of National land cover and statistical data. Centre for Geo-Information
GRID 5000*5000 meter Centre for Geo-Information
GRID 5000*5000 meter Centre for Geo-Information
Number of Grids EU-15 EU15 width: 3341 km height: 3855 km scale 5km 515,182 unique gridcells 1km 12,879,555 100 m 1,287,955,500 Centre for Geo-Information