Download
1 / 61
610 likes | 633 Views
Explore the Circular Flow Model illustrating economic transactions between households, firms, and the government. Learn about GDP calculation, what counts in GDP, Nominal GDP vs. Real GDP, and formulas. Enhance your understanding of factors affecting the economy.

E N D
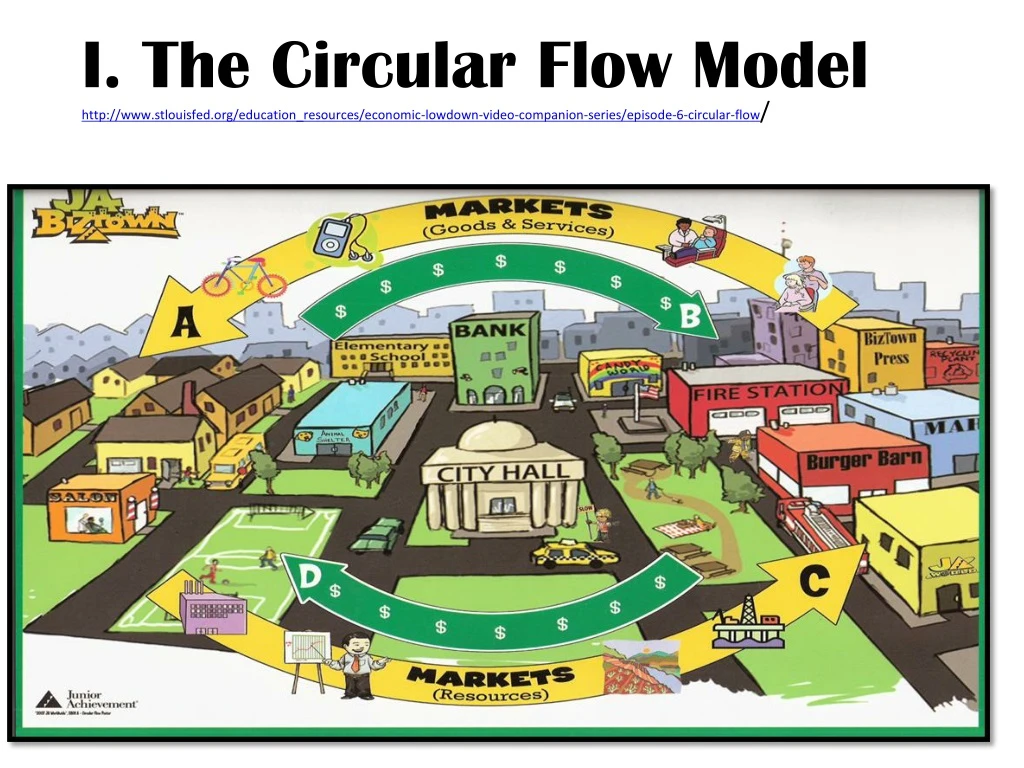
I. The Circular Flow Model http://www.stlouisfed.org/education_resources/economic-lowdown-video-companion-series/episode-6-circular-flow/
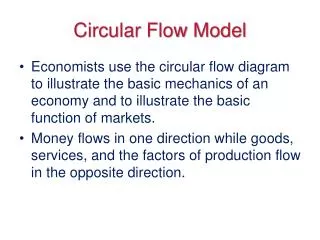
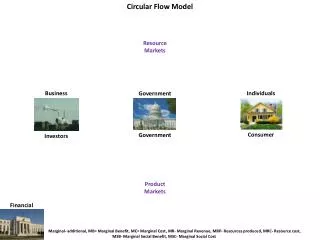
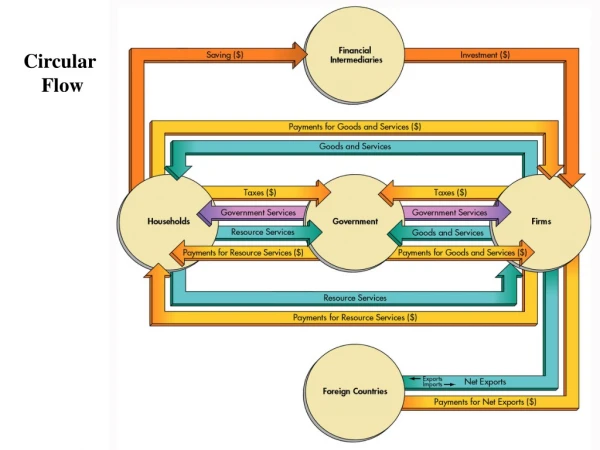
Circular Flow Diagram • Resource Market and Factor Market • Households own factors of production – sell them to Firms • Firms buy factors of production – pay wages, rent etc. • Product Market • Firms sell goods and services to households • Households pay for goods and services
Government • Resources Market – buys factors of production from households • Product Market – buys goods and services from firms • Takes in money through taxes and provides goods and services to both households and firms
Land, Labor, Capital and Entrepreneurial Ability Factor Market AKA Resource Market Households sell Firms buy Resources Money income, wages, rents, interests, profits Costs expenditures resources Goods and services Goods and services firms buy factors of production sell products Households Sell factors of production Buy products taxes taxes Government expenditures Goods and services Money, consumption expenditure Revenue Product Market Households buy Firms sell Goods and services Goods and services
GDP • Total market value of all final goods and services produced in a country in a year • Measured in “quarters” of years
GDP • Total market value of all final goods and services produced in a year • Measured in “quarters” of years • C. To avoid multiple counting only FINAL goods are counted • Intermediate goods – goods and services purchased for resale or more processing • Final goods – goods and services purchased for final use by the consumer Steel – intermediate good New car – final good
D. What doesn’t count • Second hand goods
D. What doesn’t count • Second hand goods • Gifts or transfers (social security welfare etc.)
D. What doesn’t count • Second hand goods • Gifts or transfers (social security welfare etc.) • Stock market transactions
D. What doesn’t count • Second hand goods • Gifts or transfers (social security welfare etc.) • Stock market transactions • Unreported business activities
D. What doesn’t count • Second hand goods • Gifts or transfers (social security welfare etc.) • Stock market transactions • Unreported business activities • Illegal activities http://www.euronews.com/2014/05/30/illegal-sex-and-drugs-trade-to-be-included-in-calculating-british-gdp
D. What doesn’t count • Second hand goods • Gifts or transfers (social security welfare etc.) • Stock market transactions • Unreported business activities • Illegal activities • Financial transactions between banks and businesses
D. What doesn’t count • Second hand goods • Gifts or transfers (social security welfare etc.) • Stock market transactions • Unreported business activities • Illegal activities • Financial transactions between banks and businesses • Non market activities like volunteer work
Formula • E. The expenditures approach - C + Ig + G + Xn = GDP • C = Personal Consumption • 67% of the economy • Purchases of finished goods and services • NOT houses or other construction • Ig = Gross Private Business Investment • a. Factory equipment maintenance • New factory equipment • New Construction (houses or factory) • Unsold inventory of products build in a year, but not sold in that year • G = Government Spending • Xn = Net foreign factor of Trade: Exports minus Imports • Exports = dollars in • Imports = dollars out • Since WWII, Xn has usually been a negative number C + Ig + G + Xn = GDP https://www.youtube.com/watch?v=SYFYla1H7KE
What Counts in GDP? Is it C, Ig, G, or Xn?
Nominal GDP vs. Real GDP • Nominal GDP • Total output of final goods and services produced by an economy in 1 year • b. no adjustment for inflation • Price index • Used to measure price changes in an economy • To construct select a year to serve as the base year • Prices of other years are expressed as a percentage of the base year • The value of the price index in the base year is always 100 • Real GDP • Adjusted for price changes over time • Calculated using a price index • GDP Deflator • Price index used to “deflate” nominal GDP to reflect real growth
Formulas Nominal GDP = Units of output X price price of a market basket of goods Price of same market basket in base year https://www.youtube.com/watch?v=iV4DS9aAQqM = Price index X 100 ____nominal GDP________ price index (in hundredths) Real GDP =
Price of a market basket of goods Price of same market basket in base year X 100 Price index = Price Index for year one ALWAYS = 100
price of a market basket of goods Price of same market basket in base year Price index = X 100 Price index for Year 2 20 10 X 100 = 200 =
price of a market basket of goods Price of same market basket in base year X 100 Price index =
Nominal GDP = Units of output x price 50 = 5 x 10
______nominal GDP________ price index (in hundredths) Real GDP =
______nominal GDP________ price index (in hundredths) Real GDP = 140 2 70 =
_________nominal GDP________ price index (in hundredths) Real GDP =
One More Formula https://www.youtube.com/watch?v=gqm--7s0Ks4 Nominal GDP Real GDP • X 100 • GDP deflator = G. Per Capita Output – divide real GDP by the population
Business Cycle – alternating rises and declines in economic activity A. Peak – business activity has reached a temporary maximum B. Recession – decline in total output, income, employment, and trade C. Trough – output and employment are at their lowest levels D. Recovery – output and employment rise toward full employment
E. Other business cycle measures 1. Stagflation – when inflation and unemployment rise simultaneously 2. Misery Index – a measurement that combines unemployment and inflation
Inflation – rise in general price level • Measuring inflation • CPI – consumer Price Index • One measure of inflation • Measures the cost of a consistent market basket of goods • When using Price indexes – the Index year is always 100
Inflation – rise in general price level • Measuring inflation • CPI – consumer Price Index • One measure of inflation • Measures the cost of a consistent market basket of goods • When using Price indexes – the Index year is always 100 Remember?! Price of a market basket _____in a specific year____ Price of same market basket in base year X 100 Price index =
Inflation – rise in general price level • Measuring inflation • CPI – consumer Price Index • One measure of inflation • Measures the cost of a consistent market basket of goods • When using Price indexes – the Index year is always 100 • Inflation formulas Year later CPI - year earlier CPI Year earlier CPI X 100 Rate of inflation = Rule of 70 – number of years it will take for a measure to double Number of years it will take for the price level to double ____70______ rate of inflation =
Year later CPI - year earlier CPI Year earlier CPI X 100 Rate of inflation = Calculate the rate of inflation for years 2-4 Year__________________________Price_Index________________Rate of Inflation 1 100 2 112.00 __________ 3 123.20 __________ 4 129.36 __________ 12% 10% 5%
Rule of 70 – number of years it will take for a measure to double _____70_____ rate of inflation Number of years it will take for the price level to double = How many years will it take for the price level to double if the inflation rate is 2% per year? 70 2 = 35 years Suppose it will only take 5 years for the money you have invested to double. What is the annual interest rate? 70 i = 5years i = 14%
Demand pull inflation • Spending beyond a country’s ability to produce • Excess demand bids up prices • Too much money chasing too few goods
Demand pull inflation • Spending beyond a country’s ability to produce • Excess demand bids up prices • Too much money chasing too few goods • Cost push inflation • Increase in the cost of inputs • Raises per unit production costs
D. Who is hurt • Fixed Income receivers – they see their REAL income fall • Savers • Creditors – money paid back to them has less value
E. Who is not affected • Flexible income receivers • Many get pay raises • COLAs – cost of living adjustments • Debtors – they are paying back dollars worth less than the ones they borrowed
F. Disinflation – lowering of the inflation rate • G. Deflation – lowering of price level • H. Hyperinflation – extremely rapid inflation
Hyperinflation in Zimbabwe https://www.youtube.com/watch?v=Jt15F21jpN8
Meet Sarah, Bob and Milt. They are dealing with inflation.
IV. Unemployment A. Unemployment rate = x 100 Unemployed Labor force
IV. Unemployment A. Unemployment rate = x 100 B. Who isn’t in the labor force 1. under 16 Unemployed Labor force
IV. Unemployment A. Unemployment rate = x 100 B. Who isn’t in the labor force 1. under 16 2. in the military Unemployed Labor force
IV. Unemployment A. Unemployment rate = x 100 B. Who isn’t in the labor force 1. under 16 2. in the military 3. institutionalized Unemployed Labor force
IV. Unemployment A. Unemployment rate = x 100 B. Who isn’t in the labor force 1. under 16 2. in the military 3. institutionalized 4. retired Unemployed Labor force
IV. Unemployment A. Unemployment rate = x 100 B. Who isn’t in the labor force 1. under 16 2. in the military 3. institutionalized 4. retired 5. homemakers Unemployed Labor force
IV. Unemployment A. Unemployment rate = x 100 B. Who isn’t in the labor force 1. under 16 2. in the military 3. institutionalized 4. retired 5. homemakers 6. students Unemployed Labor force