Download
1 / 31
310 likes | 424 Views
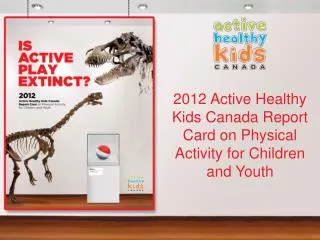
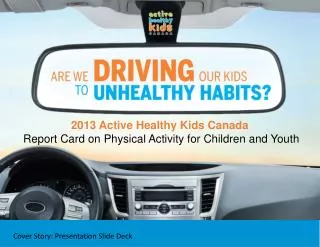
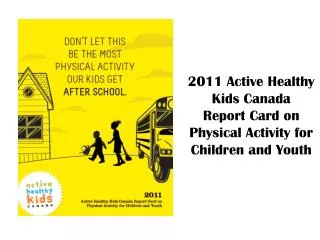
The 2014 Active Healthy Kids Canada Report Card. Thanks to our partners and funders. Framework. The 2014 Report Card assigns letter grades to 10 different indicators grouped into three categories.

E N D
Framework • The 2014 Report Card assigns letter grades to 10 different indicators grouped into three categories. • Grades are based on an examination of current data against a benchmark along with an assessment of trends over time and the presence of disparities. • Together, the indicators provide a robust and comprehensive assessment of physical activity of Canadian children and youth
Data Sources • Canadian Health Measures Survey (CHMS) • Canadian Physical Activity Levels Among Youth Survey (CANPLAY) • Health Behaviour in School-Aged Children Survey (HBSC) • Keeping Pace • Opportunities for Physical Activity at School Survey (OPASS) • Physical Activity Monitor (PAM) • Youth Smoking Survey (YSS) In addition, the long form Report Card includes a comprehensive set of references and a variety of specificrecommendations in each section and can be accessed at activehealthykids.ca.
Methodology Grade assignments are determined based on examination of the current data and literature for each indicator against a benchmark or optimal scenario, assessing the indicator to be poor, adequate, good or excellent: A = We are succeeding with a large majority of children and youth. B = We are succeeding with well over half of children and youth. C = We are succeeding with about half of children and youth. D = We are succeeding with less than half, but some, children and youth. F = We are succeeding with very few children and youth.
For more on international comparisons Journal of Physical Activity and Health Supplement International Pages (pg. 90 – 104 in the Long Form Report Card) Country Report Cards
Key insights for Canada • We’ve built it, but they aren’t coming • Culture of convenience • Kids need room to move
We’ve built it but they aren’t coming… • Canada’s highest grades are a B+ in Community & the Built Environment, a C+ in School and a C+ in Organized Sport Participation: • 95% of parents report local availability of parks and outdoor spaces, and 94% report local availability of public facilities and programs (such as pools, arenas and leagues). • There is a physical education (PE) curriculum in place at schools in every province and territory, and most students have regular access to a gymnasium (95%), playing fields (91%) and areas with playground equipment (73%) during school hours. • 75% of Canadian kids aged 5-19 participate in organized physical activities or sport.
We’ve built it but they aren’t coming… • Like most other countries with well-developed infrastructure, Canada trails at the back of the pack for overall physical activity levels • Canada’s overall physical activity levels are at a D-.
Culture of Convenience • Canadian parents look to structured activities and schools to get their kids moving. • 82% of parents agree that the education system should place more importance on providing quality physical education. • 79% of parents contribute financially to their kids’ physical activities, for example through equipment and fees, but only 37% of parents often play actively with their children.
Culture of Convenience • The social norm in Canada is to drive kids to school and other places, rather than let them bike or walk. • Canada gets a D in Active Transportation (one of our lowest grades). • For most Canadians, the socially acceptable walking distance to school is less than 1.6 km. • In Finland, which gets a B in Active Transportation, 74% of kids living 1-3 km from school bike or walk and almost all of those who live 1 km or closer do so. • Kids are less likely to use active transportation for school travel if their parents think driving their kids will save them time, is more convenient, or if they have road and neighbourhood safety concerns.
Culture of Convenience • When kids do have free time, busy lives and safety concerns mean much of it is spent sedentary. • Canada receives an F for Sedentary Behaviours (our lowest grade), tied at the bottom with Nigeria, Scotland and South Africa. • 61% of Canadian parents agree their kids spend too much time in front of the TV or computer.
Recommendations- Parents/Family • Parents should consider a mix of physical activities - such as organized sport, active play and active transportation - to ensure their children meet the daily physical activity requirements. No single strategy is sufficient on its own. • In some cases, parents must step back, do less and simply allow kids to play. • Parents should establish household rules for television and other screen use, and set reasonable limits, to break up their child’s sedentary time.
Recommendations-School • School boards and administrators should break down false perceptions of risk that inhibit physical activity and free play. • School boards and community partners should develop a travel plan identifying strategies to promote active school travel and address local barriers. • Educators should plan for opportunities to break up sedentary time throughout the school day (before school, during curriculum time, at recess, lunch hour, after school).
Recommendations - Policy • Active transportation needs to be considered before schools are closed or new schools are built, to ensure that a greater proportion of children and youth live within walking or biking distance of their school. • Municipalities must do away with policies that restrict opportunities for active outdoor play. • Provide time in facility schedules for drop-in, spontaneous activities. Many arenas and gyms are booked for organized activities that do not serve all children and youth. • Assist parents to manage safety concerns through policies (e.g. traffic speed enforcement, provision of crossing guards) and strategies (e.g. neighbourhood watch program, walking school bus, shared supervision) so that children have greater independent mobility to actively travel with friends to places to be physically active. • Municipalities should conduct a health impact assessment when they do their planning (e.g., to approve a new subdivision or road) or implement a new policy (e.g. consider any negative implications the policy will have on outdoor play). • Lower- and better-enforced speed limits, traffic calming measures (e.g., speed bumps), greater sidewalk coverage and crossing guards near school, libraries, playgrounds and community centres are all measures that could improve safety and help encourage parents to allow their children to walk or cycle more.
Recommendations – Strategies & Investments • Governments at all levels should target policies to eliminate disparities in access and participation levels. • P/T Governments should develop physical activity action plans and policies aligned with Active Canada 20/20, the National Recreation Framework and the Canadian Sport Policy. • Governments at all levels need to improve the level of funding devoted to health promotion including physical activity promotion, physical education and entry-level sport participation to reflect the realities of cost savings to be attained in the future as a result of a more physically active population. • There is a need for increased coordination of investments and policies between public and private sectors and across all levels of government to ensure alignment between strategies and investments and to minimize duplication and possible inefficiencies.
The Report Card serves as… • A public awareness mechanism and call to action through a nationwide media strategy • An accountability index for all Canadians • A surveillance synthesis mechanism • An advocacy tool for physical activity leaders and organizations • A policy driver • A process for identifying research and surveillance needs • A challenge to other countries and jurisdictions to implement similar processes to allow comparisons and facilitate improvements
Examples of 2014 Media Coverage Toronto Star Globe & Mail Mississauga News
Communications Tools Long & Short Form Report Cards available on our website. http://www.activehealthykids.ca/ReportCard/2014ReportCard.aspx Hard copies available for ordering. Click hereto order and for more information.
Communication Tools http://www.activehealthykids.ca/ReportCard/2014-report-card-communications-tools.aspx