Climate Forcing and Feedback
580 likes | 600 Views
Explore how to estimate planet temperature changes due to energy balance shifts, climate forcing, sensitivity, and feedback interactions. Discover the impacts of positive and negative feedback loops on Earth's climate system.

Climate Forcing and Feedback
E N D
Presentation Transcript
We looked at how to estimate the temperature of a planet. • This was based on equilibrium between energy absorbed by the planet and energy radiated from the planet • Suppose that something in the system changes • More energy comes from the sun. • More energy is trapped by the atmosphere. • More energy is radiated away from the planet
How do we estimate the change in the equilibrium temperature?
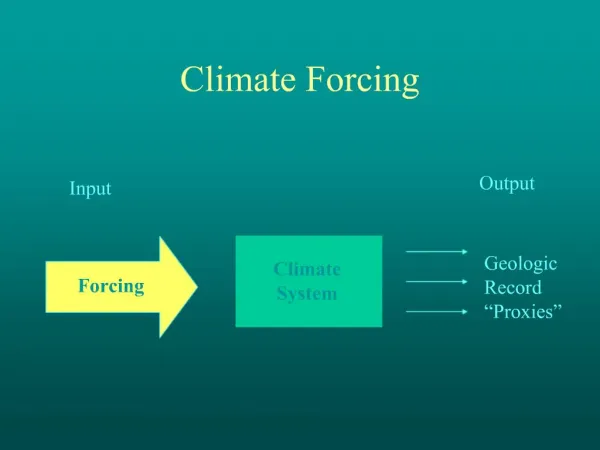
Climate Forcing • Any change in the earth’s energy balance is referred to as climate forcing. • The net effect should be much the same whether it is due to an increase in incoming energy or if it is due to increased trapping by greenhouse gases.
In Equilibrium: Energy in = Energy out
Climate Forcing: If we force the climate by increasing energy input (E) our equation would be Energy in + E = Energy out If we force the climate by reducing the energy out by an amount (E) our equation would be Energy in = Energy out - E SAME EQUATION – DIFFERENT INTERPRETATION!
The prior discussion has been in terms of energy flows. In our calculations, we have used power per unit area. • Climate Forcing is typically talked about in terms of changes in W/m2.
Example: Estimate the change in temperature on earth due to a 5 W/m2 energy forcing • Use our simple model without atmosphere: • Let the 5 W/m2 be due to an increase in the solar input form 239 W/m2 to 244 W/m2. (2.1% increase). 244 W/m2 = eT4 or T = 256 K Previously 255 K. This is an increase of 1C
Climate Sensitivity • Policy makers would like to have a simple measure of how a given climate forcing will change the temperature: • Climate sensitivity G = T/F • Note: units are C/(W/m2)
Linear vs. Nonlinear Response Once we know the climate sensitivity, if the response is linear, we can multiply it by any forcing to get the change in temperature. If the response in nonlinear, the problem is much harder.
0-D energy balance climate sensitivity Notes: 1) derivation of this requires calculus 2) 5 W/m2 T= (0.266)(5)=1.33C
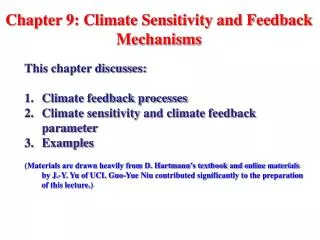
Feedback • Our value of G = 0.266 C/(W/m2) is low because we have left out some information, mostly feedback. • Two type of feedback, negative and positive.
Equilibrium occurs when the energy coming to the Earth from the Sun equals the energy radiated by the Earth • True • False
The factor G = DT/DF is the • Climate sensitivity • Climate forcing • Gravitational constant • Gibbs free energy
Climate forcing is • Caused solely by human activity • Any change in the Earth’s energy balance • Caused solely by natural forces
Negative Feedback • Negative feedback effects tend to counter act the changes that initially gave rise to them. • Example: House thermostat: When the temperature drops, the furnace turns on and heats up. When the temperature goes too high, furnace turns off and the house will cool.
When CO2 goes up, plants grow more quickly and remove some of the CO2. • A warming earth tends to cause more clouds (evaporation increases) but the clouds increase the earth’s albedo so not as much energy enters the atmosphere and the earth cools. • Increased temperature can reduce vegetation (deserts) which also increase the albedo.
Note: negative feedback works in both directions. • If the earth cools it results in a decrease in cloud cover. The albedo is reduced and the earth warms. • Question: Can negative feedback reverse initial warming?
Positive Feedback • Positive feedback tends to increase the initial change. • Imagine a thermostat that turns the furnace on when the temperature gets hot.
Water vapor is a powerful greenhouse gas. If we increase the temperature, more water evaporates. This adds more GHG to the atmosphere and traps more heat thus increasing the temperature more. (Note that water in clouds was a negative feedback, but water vapor is a positive feedback.) • Ice-albedo effect: Increased temperature causes sea ice to melt. The darker water absorbs more energy thus causing additional warming which causes more sea ice to melt.
Just like negative feedback, positive feedback works both ways. • If the earth cools, more sea ice forms. This increases the albedo which reduces the amount of energy absorbed. The reduced energy absorption causes further cooling which in turn causes more sea ice.
The effects of feedback are active areas of research. Of particular interest are the effects of clouds and water vapor.
A process which produces a change that opposes an initial change is an example of • Positive feedback • Negative feedback
Modeling Feedback • Use the “Black Box” approach. Without feedback, we take an initial forcing, put it into our black box and out comes the temperature change. For our linear system T = 0.266F or G0 = 0.266
The feedback is a response to the initial forcing and modifies the forcing itself
Feedback • Feedback increases or decreases the effect of the initial forcing.
New Climate Sensitivity • For positive feedback fis positive and G > G0 • For negative feedback fis negative and G < G0. • No matter how large the magnitude of negative f , G is always positive.
Example • The best IPCC estimate for climate sensitivity is G = 0.67C/(W/m2). • 0-D model gave a value of G0 = 0.266 C/(W/m2). • What is the value for the net feedback, f ?
Real Forcings. • For a baseline, we will use conditions in the pre-industrial era (250 yrs ago.) • Note: There are definitely natural changes that occur in climate. We want to know if we are causing additional change.
The source of the data is the Intergovernmental Panel on Climate Change (IPCC) • Note that all but the possible change in solar output are anthropogenic • Volcanic activity is another natural but highly variable forcing.
Greenhouse Gases • GHG are the dominant forcing agents. • CO2 • Methane • N2O • Halocarbons • The GHG remain in the atmosphere long enough that they are well mixed
Sources of GHG • N2O comes from use of fertilizers with some addition from combustion of fuels. • Halocarbons are products such as CFCs (now banned because of ozone depletion) and HCFCs (safe for ozone, but still a greenhouse gas.) • Methane comes from natural gas releases, coal mining, sewage treatment plants, landfills, cows, rice paddies, etc.
Sources of Carbon Dioxide • Major source for carbon dioxide forcing come from burning fossil fuels. (75%) • Other major contribution is land use, mostly tropical deforestation.
CO2 concentration at Mauna Loa observatory in Hawaii. Note the annual oscillation caused by the seasonal growth of plants.
Evidence for the anthropogenic origin of CO2 change • CO2 concentration tracks the known emission from the burning of fossil fuels.
Evidence for the anthropogenic origin of CO2 change • CO2 concentration tracks the known emission from the burning of fossil fuels. • CO2 is well mixed in the atmosphere, but its concentration is slightly higher in the northern hemisphere than in the southern.
Evidence for the anthropogenic origin of CO2 change • CO2 concentration tracks the known emission from the burning of fossil fuels. • CO2 is well mixed in the atmosphere, but its concentration is slightly higher in the northern hemisphere than in the southern • The ratio of carbon-14 to carbon-12 is decreasing. • C-14 would have decayed long ago in the fossil fuels.
Global Warming Potential • GHG vary in their ability to trap IR radiation, • One molecule of Methane is 26 times more effective at IR absorption then one molecule of CO2. • Effectiveness also depends on the lifetime in the atmosphere. • Methane remains in the atmosphere for about a decade, CO2 has an effective lifetime of ~1000 years.
Global Warming Potential • GHG vary in their ability to trap IR radiation, • One molecule of Methane is 26 times more effective at IR absorption then one molecule of CO2. • Effectiveness also depends on the lifetime in the atmosphere. • Methane remains in the atmosphere for about a decade, CO2 has an effective lifetime of ~1000 years.
In the near term a given amount of Methane cause a much greater forcing than the equivalent amount of CO2, but wait 100 years and the CO2 is still there warming while the Methane is long gone. • We define the effectiveness of a greenhouse gas relative to CO2 as its global warming potential (GWP).
Concentration and Forcing • In general, the higher the concentration of a GHG, the more IR it absorbs, BUT if all of the IR ath the wavelength in question is being absorbed, the addition of more GHG doesn’t really matter.