Download
1 / 20
200 likes | 316 Views
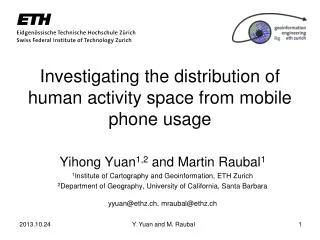
Investigating the distribution of human activity space from mobile phone usage. Yihong Yuan 1,2 and Martin Raubal 1 1 Institute of Cartography and Geoinformation, ETH Zurich 2 Department of Geography, University of California, Santa Barbara yyuan@ethz.ch, mraubal@ethz.ch. Background.

E N D
Investigating the distribution of human activity space from mobile phone usage Yihong Yuan1,2 and Martin Raubal1 1Institute of Cartography and Geoinformation, ETH Zurich 2Department of Geography, University of California, Santa Barbara yyuan@ethz.ch, mraubal@ethz.ch
Background • Information and communication technologies (ICTs) • Greater mobility flexibility • A wide range of Spatio-temporal data sources • Modeling the activity pattern of phone users • Call Detailed Records (CDRs) • Low resolution / precision • Uncertainty?
Background • Activity space of human beings • “the local areas within which people travel during their daily activities” • How to measure an activity space • Size • Shape • Regularly visited places (e.g., home, work) • ……
Objective & Motivation • Explore the distribution of activity space of phone users based on (CDRs) • Why is this important? • Large scale, urban oriented research • Model fitting • Abstract and generalized indicators • Provide reference for various fields • A neat fitted distribution can facilitate comparison between cities/countries/cultures, etc…
Methodology • Three measures of Activity space • Radius -> Scale • Eccentricity -> Shape • Shape Index: 1- Eccentricity • Entropy->Regularity Transformation of Trajectories (Gonzalez et al. 2008).
Example dataset • Mobile Phone Connections in 10 cities in Northeast China • 3 large, 5 median, 2 small • Time, duration, and locations of mobile phone connections over 9 days
Descriptive plots(Probability density functions) • Radius • (b)
Probability distribution functions • Shape Index
Probability distribution functions • Entropy
Model Fitting • Various models • Why model fitting is needed sometimes • Exponential… • Skewed normal… • Cross-variable comparison • One flexible model for all three variables • Weibull distribution • For exploratory analysis • Both cross-city and cross-variable comparison
Weibull distribution ( ) • An effective model in various applications such as industrial engineering • where k > 0 is the shape parameter and λ > 0 is the scale parameter of the distribution. • With k=1, the Weibull distribution turns into an exponential distribution • The combination of simplicity and flexibility in the shape of the Weibull distribution
Weibull Distribution (Cont.) • Scale parameter lamda • How much the curve stretches out • When k stays the same, The larger lamda is, , the distribution gets stretched out to the right and its height decreases, while maintaining its shape and location.
Discussion • The distribution of radius is close to an exponential distribution (k2≈1) • The decay of Shape Index is faster than exponential (k3<1). It also shows that the distribution of Entropy is similar to a skewed normal distribution (k1≈2).
Application • We have also constructed a regression model showing that • k2 is significantly correlated with the size of the cities, indicating that bigger cities have a faster decay trend for individual activity radii. • city size is not significantly correlated with either entropy or SI.
Summary • Weibull distribution • Fit into three variables • The distribution of radius is close to an exponential distribution
Future Work • Further examine other potential factors • Test the robust of the method • Apply to other data • Applications
Acknowledgement • This research is funded by: • Swiss National Science Foundation, Grant No. 141284