Download
1 / 13
360 likes | 1.12k Views
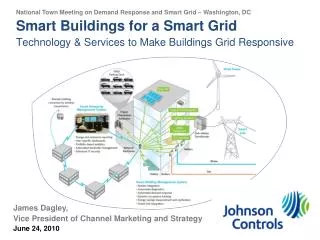
National Town Meeting on Demand Response and Smart Grid – Washington, DC. Smart Buildings for a Smart Grid Technology & Services to Make Buildings Grid Responsive. James Dagley, Vice President of Channel Marketing and Strategy June 24, 2010. Intro to Johnson Controls.

E N D
National Town Meeting on Demand Response and Smart Grid – Washington, DC Smart Buildings for a Smart GridTechnology & Services to Make Buildings Grid Responsive James Dagley, Vice President of Channel Marketing and Strategy June 24, 2010
Intro to Johnson Controls 140,000 Employees Fortune 100 Multi-Industry Company • Founded in 1885 by Warren Johnson, inventor of the first electric room thermostat • Over 40,000 employees dedicated to building efficiency in 500+ locations in 125 countries • Market leader in HVAC and controls technology • 13,000 HVAC technicians, 12,000 facility mgrs • Over 1.4B sq ft of space under direct management, with services provided to a further 20B sq ft • Largest ESCO in North America with over $4.9 billion of active cost savings guarantees 2
Technologymakes the smart grid possible… . …and buildings are the next wave Source: Johnson Controls analysis of $3.4 billion in SGIG awarded October 2009
Commercial buildings – big load, large potential U.S. Electricity Demand (GW) Half of U.S. peak demand is medium to large facilities (>20 kW) Potential Impact of DR (10-yr) Large C&I 4% Residential 20% Small C&I Medium C&I Source:North American Electric Reliability Corporation (2009) “2009 Summer Reliability Assessment” FERC (2009) “A National Assessment of Demand Response Potential”
The Building Perspective on Demand Response Cost-Effective Convenient • What do mid to large commercial buildings require in order to be interested in DR? • Cost-Effective – economics have to work out • Convenient – building operators cannot take on a “second job” to manage load shedding • Control – unwilling to allow outside parties (utility, service provider, etc) complete control over load Technology Control Demand Response technology can help with all three
Cost-effective – Automating DR on operations budgets Installation cost for DR automation technology Median payback of projects under PG&E’s Auto-DR program is 2.25 years Source: PG&E/LBNL AutoDR Pilot, 2006.
Convenient – If it’s not easy, no one will do it 5% load response without technology vs. 10%load response with auto-DR technology Two pilot studies show that automation leads to better response Source: Global Energy Partners (2007) “PG&E 2007 Auto-DR Program Assessment” 2006 CRA SPP C&I Report; Demand Response Research Center
Control – A “Spectrum” of Demand Response Options Logic, decision-making and control can sit with the load-serving entity, the customer, or anywhere between (e.g. an curtailment service provider): Central Control Autonomous Control Critical Peak Pricing Wholesale EnergyPrograms Voluntary Demand Bidding Pure Real Time Price Interruptible Rate Wholesale CapacityPrograms Traditional “Aggregator” Model Historical DR has been centrally controlled, but there is a push to the right of the spectrum. Buildings benefit. Direct Load Control(AC Cycling)
Technology can help with cost-effectiveness, increase convenience and maintain control Market-Based Event-Based Direct Load Control Fixed Time of Use Pricing Curtailment/Interruptible Rate Critical Peak Pricing Demand Limiting Demand/Capacity Bidding Dynamic Pricing (RTP) Smart Grid BMS Integrated Supervisory Control Energy Storage Energy Loads Onsite Generation -Set Points -On/Off Minimize Energy Cost Maximize Comfort Building owner pre-defines load reduction strategies, levels and thresholds based on and comfort and cost preferences
An example of an automated demand response event 1 9 High summer temps drive up cooling loads 8 2 Automatically dims lighting Dispatches thermal storage or gen-sets in response to loss in solar PV output Marginal cost of power increases, T&D systems become congested 7 Throttles servers for non-critical applications Provides real-time visibility to building managers 4 3 Ensures fans don’t overcompensate for new CHW set points 6 5 Curtailment signal or real time price provided by ISO/utility Adjusts space temp, and chilled water temp set points Prevents PHEVs from charging during peak hours 10 11
Case Study – Automated Demand Response:Georgia Institute of Technology • Georgia Institute of Technology is on a dynamic hourly tariff from Georgia Power • Each hour, building management system reads prices for for next 48 hours from utility’s web service feed • Facilities director sets price threshold for automated load shedding mode Savings during initial summer 2006 pilot Observing a 1MW peak load reduction, ~7% of load for participating buildings 12
Thank You 13