Download
1 / 35
350 likes | 497 Views
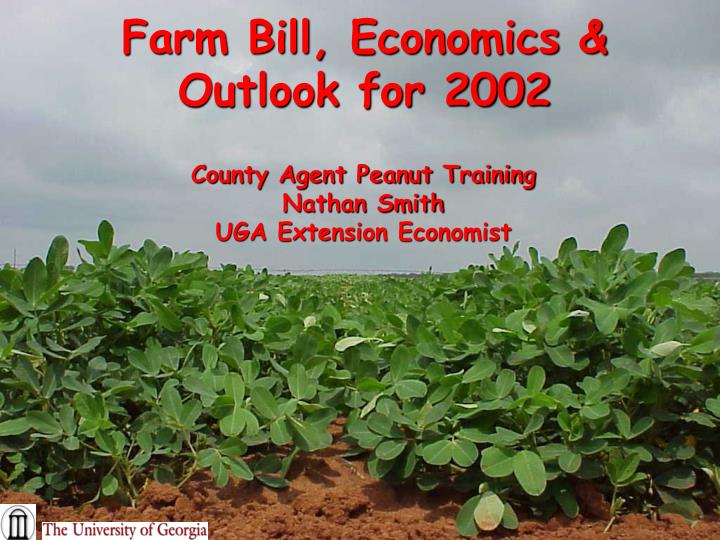
Farm Bill, Economics & Outlook for 2002. County Agent Peanut Training Nathan Smith UGA Extension Economist. Peanut Situation. Bumper crop in Southeast Over supply situation Domestic use down 3.3% from last year Exports down in 1 st quarter Quota kept at 2001 level

E N D
Farm Bill, Economics & Outlook for 2002 County Agent Peanut Training Nathan Smith UGA Extension Economist
Peanut Situation • Bumper crop in Southeast • Over supply situation • Domestic use down 3.3% from last year • Exports down in 1st quarter • Quota kept at 2001 level • Argentina currency devaluation impact? • Farm Bill in 2002 or 2003?
US Peanut Production, Quota, and Food Use Effective Quota is Basic Quota plus Undermarketings 1990-95, and Basic Quota plus Buybacks 1996-00.
Planted Acres by Region US SE GA SW VC
1999/00 2000/01 Est. 2001/02 Proj. Beg. Stocks 1,392 1,233 1,116 Production 3,829 3,266 4,157 Imports 178 204 178 TOTAL SUPPLY 5,400 4,703 5,451 Food Use 2,233 2,170 2,275 Crush 713 548 800 Exports 727 519 725 Seed & Res 493 341 351 TOTAL USE 4,166 3,588 4,076 Ending Stocks 1,233 1,116 1,375 Average Price 25.4 27.4 U.S. Peanut Balance Sheetmillion pounds (Dec 12, 2001)
Marketing Assessment • GFA has approximately 243,000 tons of quota in loan • Another 145,000 tons of additionals are in the loan pool • 243,000 tons * $400 loss = 97.2 mil. Loss • SE has ~ 692,000 tons quota • Marketing assessment could be as much as $140/ton not counting additional losses or gains
What do I need from the Market?Irrigated Budgets * 2002 UGA CES Cost of Production Budgets Note: Land and Quota costs not included
What do I need from the Market?Dryland Budgets * 2002 UGA CES Cost of Production Budgets Note: Land and Quota costs not included
Trade Situation • US is preparing for WTO negotiations • FTAA has been stalled since the Sep. 11 attack • Argentina facing a currency devaluation
Tariff Rates # Tariff rates on a pound of shelled peanuts
Argentina • Main exporter of peanuts into US • Allocated 78% of the in-quota TRQ (Tariff Rate Quota) • Amounted to 43.9 thousand metric tons last year • Main competitor in the European Market • Arg 43% market share from 98-00’ • US 26% market share from 98-00’
Argentina Exchange Rate • Austral pegged to US dollar in 1991 • Austral replaced by Peso in 1992 at a fixed rate of 1:1 to the US dollar • Peso became overvalued by being tied to the US dollar • May 2001 figures show 80-90% overvalued, reduces Argentina’s competitiveness in the world market
Recent Changes in Argentina’s Exchange Rate • New temporary official exchange rate of 1.4 Pesos/US $ • Argentina price is estimated to still be above US price (57.5 cents/pound) with 131.8 tariff rate (using 34.8 cents/lb + 2 cents/lb shipping cost) • Soon will be allowed to float freely (this summer)
What if Exchange Rate continues to drop? • The current free market exchange rate is closer to 1:1.6 • At 60% devaluation, Argentina peanuts produced using >80% domestic inputs would be below the US price • Would make the tariff rate quota meaningless as a protection measure
Farm Bill Chronology and Timetable • House Ag Committee presents HR 2646 • -- July 27, 2001 • HR2646 passed the House • -- October 5, 2001 • Senate Ag Committee passes S 1628 • -- November 15, 2001 • “Harkin Bill” presented S 1731 to the Senate • -- November 27, 2001 • Senate Adjourned December 21 without a vote • Senate reconvenes next week • Senate vote • House-Senate conference committee • President • FSA must write regulations
Major Components Of The Bill -- Provisions That Impact Income -- • Loan Rate • AMTA or Fixed, Decoupled Payments • Base • Target Price • Payment Acres • Payment Yield • Payment Limits
Marketing Loan • Non-recourse Marketing Loan for all peanuts produced. • LDP could be taken on peanuts instead of actually taking out a loan. • Payment limitation of Marketing Loan gains and LDPs is proposed at $150,000 (House)
Fixed, Decoupled Payments • New name for AMTA payments. • Peanuts would received a Fixed, Decoupled Payment of $36 per ton. • “Historical Producer” is defined as having peanuts sometime during the 1998-2001 time period on a farm. • Payment limitation: • $50,000 (House) • $100,000 combined with CCP (Senate)
Counter-Cyclical Payments • Establish a payment to producers with peanut base. • Not tied to production • Payments would be triggered when the average season price for peanuts falls below a target price. • Payment limitation: • $75,000 (House) • $100,000 combined with FDP (Senate)
Counter-Cyclical Payment Calculation • CCP = TP - ASP - FDP • or • TP - NLR - FDP, whichever is higher. • CCP = counter cyclical payment • TP = target price, $480 • ASP = average season price • FDP = fixed, decoupled payment, $36 • NLR = national loan rate, $350
Comparison of House and Senate To Current Program Impact: Will create major tension between some Georgia landowners/quota holders and producers. Will give the producer leverage for 180 days. Creates the opportunity for long term leases to be negotiated. Total bases of All crops cannot exceed cropland on the farm.
Comparison Of Payments @ 375/ton Peanuts *Additional peanuts
FARMCATS... Field And Resource Management Cost Accounting Tracking System
A tool to help producers • track and organize real time cost, • track and organize production data, including pesticide and water usage • determine total costs, • compare the performances of individual fields and the whole farm operation with break-even analysis, • aid in management decisions • in a user-friendly format Overall, an effort to enhance the COMPETITIVENESS of US peanut producers.
We Need Your Help • Cost of Production Survey for Southeast • Target Sample Size – 700 from GA,FL,AL • Representative Farms • 7 in Georgia • 2 Alabama • 2 Florida • 1 South Carolina
UGA Peanut Team www.ugapeanuts.com