Download
1 / 9
90 likes | 243 Views
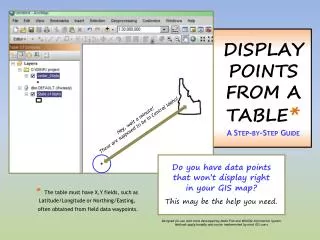
Display points from A table * A Step-by-Step Guide. Hey, wait a minute! These are supposed to be in Central Idaho!. Do you have data points that won’t display right in your GIS map? This may be the help you need .

E N D
Displaypointsfrom Atable*A Step-by-Step Guide Hey, wait a minute! These are supposed to be in Central Idaho! Do you have data points that won’t display right in your GIS map? This may be the help you need. * The table must have X,Y fields, such as Latitude/Longitude or Northing/Easting, often obtained from field data waypoints. Designed for use with tools developed by Idaho Fish and Wildlife Information System. Methods apply broadly and can be implemented by most GIS users.
Add the State of Idaho file(from LayerFetcher *)Selected here because it’s in the standard projection used by state data, is visible statewide,is a (simple) single record file, and most data points will fall within state boundaries. *Get Layer Fetcher (If you work for IDFG): https://www.fishandgame.idaho.gov/ifwis/portal/blog/arcmap-10-add-ins-accessing-new-layerfetcher-tools
Add your tablewith data points(eg, an Excel spreadsheet – specify a worksheet if necessary) In your project,Right-click on the table Select Display XY data
Match up the fields For Coordinate System ofInput Coordinates, click Edit… Helpful Tip: X = Lon = East/West (eg, -116.####) Y = Lat = North/South (eg, 42.####) Z = elevational attribute (optional )
Open the Geographic Coordinate Systems folder Open the Worldfolder SelectWGS 1984 (or the system you need to work with) (Hint: Add this coordinate system to Favorites so it’s easy to find next time) ClickOK
Export Data to add therequired Object ID field Click OKon the Object ID error message
Browse to folder orgeodatabase location To save as a Feature Class, select a geodatabase To save as a Shapefile, select a folder
Specify the same coordinate system asthe data frame (set when adding the State of Idaho) Add the layer to your existing project. Now you can correctly display and analyze your data points. Voila! Points should display in the correct location. Topic design by Cyndi Coulter and Pam Bond Idaho Fish and Wildlife Information System Idaho Fish and Game <> 2013