Download
1 / 22
220 likes | 376 Views
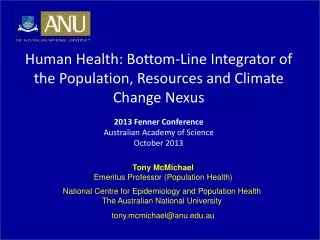
Human Health: Bottom-Line Integrator of the Population, Resources and Climate Change Nexus 2013 Fenner Conference Australian Academy of Science October 2013. Tony McMichael Emeritus Professor (Population Health) National Centre for Epidemiology and Population Health

E N D
Human Health: Bottom-Line Integrator of the Population, Resources and Climate Change Nexus 2013 Fenner Conference Australian Academy of Science October 2013 Tony McMichael Emeritus Professor (Population Health) National Centre for Epidemiology and Population Health The Australian National University tony.mcmichael@anu.edu.au
Climate Change: Health Impact Pathways Glaciers; river flows; ocean temperature, pH, currents; sea-level rise; nitrogen & phosphorus cycles. Soil health; forests; coastal zones; biodiversity; etc. Property damage; lower productivity; jobs; displacement; resource-related conflict and warfare Influences on social, infra-structural and economic conditions Influences on natural biophysical systems Influences on biological and ecological processes Climate Change 2 1 Indirect impacts: system-mediated 3 1 1 1 Ecological changes:food yields,water quality,mosquito populations, etc. Health Impacts Injury/death;mental stress Heat stress, deaths Direct impacts viaextreme weather events, heat-waves, worsened air pollution Infectious diseases Under-nutrition Mental stress/disorders Trauma/deaths McMichael AJ, 2013
Climate Change Influences on Health in Australia • Already apparent: prior risks amplified by climate change • Uptrend in av annual no. of heat-days deaths, hospitalisations • Increase in no./severity bushfires injury/death, resp. hazard, mental health • Current probable health impacts: but not clearly identified/identifiable • Rise in food-borne diarrhoeal disease • Altered air quality: ozone formation, aeroallergens • Mental health impacts, particularly in some (drying) rural regions • Predicted future health impacts • Extreme weather events: injuries, deaths, inf. disease, depression • Water shortages: food yields, hygiene, recreation • Mosquito-borne infections: • Dengue, Ross River virus, Barmah Forest virus, • Japanese encephalitis, chikungunya (?), etc. • Thermal stress in outdoor workers: behaviours, injuries, organ damage; output • Physical and behaviour-based health impacts in affected rural communities
Heatwaves, Illness Events and MortalityMelbourne, Australia, 2009 Ambulance attendances for heat-related illnesses in Metropolitan Melbourne: 19 Jan – 1 Feb, 2009 27-31 January 2009: maximum temperatures 12-15°C above summer norm 250 200 150 100 50 0 50 45 40 35 30 25 20 15 10 5 0 45°C Maximum Temperature Number of ambulance attendances Temp oC Heat Stress Dehydration Heat Stroke Jan 29-30: 60% increase in ambulance call-outs 126 out-of-hospitaldeaths (vs. 44 expected deaths) Jan: 19 20 21 22 23 24 25 26 27 28 29 30 31 1Feb Date SOURCE: January 2009 Heatwave in Victoria: an Assessment of Health Impacts. State of Victoria 2009
2013 Bennett CM, Dear KBG, McMichael AJ Winter deaths Ratio, Summer:Winter Summer deaths
Dengue Fever: Estimated habitable zone for Ae. aegypti mosquito vector, under alternative CSIRO climate-change scenarios for 2050 . . Darwin . Katherine . Cairns . . Broome . ~ +1.0-1.5oC Townsville . Darwin . Port Hedland . Mackay Risk region for medium emissions scenario, 2050 . . Katherine Rockhampton . Cairns . Carnarvon . Broome Townsville . Port Hedland Mackay . . Current risk region for dengue transmission Rockhampton . Darwin . Brisbane . Katherine . Cairns . . Broome Townsville . ~ +1.5-2.0o C Port Hedland . Mackay . Risk region for high emissions scenario, 2050 Rockhampton Carnarvon NCEPH/CSIRO/BoM/UnivOtago, 2003
2050 A2 2100 A2 Source of maps: P. Lehodey Russia USA c. 2000 Aust Skipjack tuna 2050 A2 1,727,000 m tonnes/yr 432,000 mt Loukos H., Monfray P., Bopp L., Lehodey P. (2003) Potential changes in skipjack tuna habitat from a global warming scenario: modeling approach and preliminary results. Fisheries Oceanography, 12(4): 474-482 2100 A2
Health Impacts, Worldwide, Attributable to Climate Change Recent uptrend in adverse health impacts from cyclones, storms, wild-fires, flooding Increasing annual deaths from heat-waves in several countries Shifts in range and seasonality of some climate-sensitive infectious diseases (and their vectors) Contribution to declines in food yields in some regions: risk of malnutrition-related child development Adverse mental health consequences in various rural communities affected by drying
Australia’s Big Methane (burp) Emitters Ruminant mammals have fore-stomachs to pre-digest cellulose in grasses and other plants. That generates ‘enteric’ methane – a potent greenhouse gas – in large volume. The rising demand for beef in developing countries puts further pressure on the climate system.
Relationship between late-spring normalised (soil) water balance (a function of temperature and rainfall) and barley yields in the Czech Republic during the past century.
New York Autoimmune disorders, and ricketts in children Skin and eye damage, and skin cancers % increase in daily mortality Health risks Low High Level of exposure to solar UVR Maximum daily temperature oC
USA ChichénItzá N SAmerica Chichén Itzá Uxmal YUCATAN Coba 20 o N MAYA LOWLANDS (less rain, more groundwater) 18 o N El Mirador BELIZE Palenque PETÉN AREA Tikal MEXICO Caracol 16 o N GUATEMALA MAYA HIGHLANDS Copan HONDURAS (more rain, less groundwater) 14 o N EL SALVADOR
Classic Maya Civilization: Two High-Resolution Reconstructions of Rainfall Orange graph = coastal sediment: Titanium concentration in subannual micro-layers Blue graph = cave (Belize) speleothem (stalagmite: U/Th-ratio dating; Oxygen isotope) Cave stalag- mite, Belize O16:O18 Cariaco Basin, Caribbean Coastline Titanium 0.3 0.2 0.1 Classic Maya Decline and Collapse, 700-1100 CE ‘Great Drought’: SW USA, Central America, S Peru Adapted from: Kennett et al. Science 338, 2012
Daisy NapaltjarriJugadaiMuruntji This painting depicts the artist’s home country around Muruntji, well known for its abundant bush tucker and wild flowers. Acrylic on canvas.
Late Pleistocene Holocene Australia: Estimated relative dryland population, based on 908 wide-spread archaeological sites Estimated global temperature (EPICA) Last Glacial Maximum (LGM), in Australia New ENSO Cycle, evident from around 4K BP Smith MA, et al. Human-environment interactions in Australian Drylands … The Holocene 2008 Years Before Present
Impact of El Niño events in Australian arid zone, based on archaeological records Williams A, et al. Revista de AntropologiaChilena 2008 Terminal phase of Pleistocene Onset of current ENSO cycle Sandy desert in Australian arid zone: Simpson Desert. Photo, May 2006, by MA Smith Holocene Intensity of El Niño Events 5,000 15,000 908 archaeological sites Years Before Present
Tigris River Euphrates River Map of Ancient Mesopotamia 200 km URUK Persian Gulf