Download
1 / 1
10 likes | 215 Views
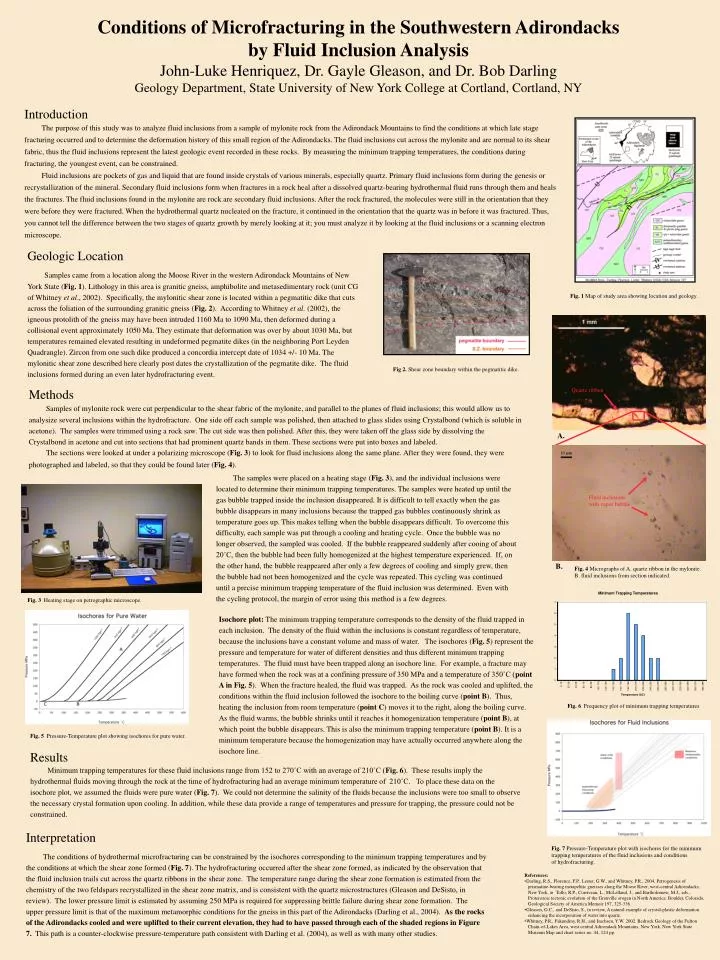
A. B. Fig. 4 Micrographs of A. quartz ribbon in the mylonite. B. fluid inclusions from section indicated. .

E N D
A. B. Fig. 4 Micrographs of A. quartz ribbon in the mylonite. B. fluid inclusions from section indicated. Conditions of Microfracturing in the Southwestern Adirondacks by Fluid Inclusion AnalysisJohn-Luke Henriquez, Dr. Gayle Gleason, and Dr. Bob DarlingGeology Department, State University of New York College at Cortland, Cortland, NY Introduction The purpose of this study was to analyze fluid inclusions from a sample of mylonite rock from the Adirondack Mountains to find the conditions at which late stage fracturing occurred and to determine the deformation history of this small region of the Adirondacks. The fluid inclusions cut across the mylonite and are normal to its shear fabric, thus the fluid inclusions represent the latest geologic event recorded in these rocks. By measuring the minimum trapping temperatures, the conditions during fracturing, the youngest event, can be constrained. Fluid inclusions are pockets of gas and liquid that are found inside crystals of various minerals, especially quartz. Primary fluid inclusions form during the genesis or recrystallization of the mineral. Secondary fluid inclusions form when fractures in a rock heal after a dissolved quartz-bearing hydrothermal fluid runs through them and heals the fractures. The fluid inclusions found in the mylonite are rock are secondary fluid inclusions. After the rock fractured, the molecules were still in the orientation that they were before they were fractured. When the hydrothermal quartz nucleated on the fracture, it continued in the orientation that the quartz was in before it was fractured. Thus, you cannot tell the difference between the two stages of quartz growth by merely looking at it; you must analyze it by looking at the fluid inclusions or a scanning electron microscope. Geologic Location Samples came from a location along the Moose River in the western Adirondack Mountains of New York State (Fig. 1). Lithology in this area is granitic gneiss, amphibolite and metasedimentary rock (unit CG of Whitney et al., 2002). Specifically, the mylonitic shear zone is located within a pegmatitic dike that cuts across the foliation of the surrounding granitic gneiss (Fig. 2). According to Whitney et al. (2002), the igneous protolith of the gneiss may have been intruded 1160 Ma to 1090 Ma, then deformed during a collisional event approximately 1050 Ma. They estimate that deformation was over by about 1030 Ma, but temperatures remained elevated resulting in undeformed pegmatite dikes (in the neighboring Port Leyden Quadrangle). Zircon from one such dike produced a concordia intercept date of 1034 +/- 10 Ma. The mylonitic shear zone described here clearly post dates the crystallization of the pegmatite dike. The fluid inclusions formed during an even later hydrofracturing event. Fig. 1 Map of study area showing location and geology. Fig 2. Shear zone boundary within the pegmatitic dike. Quartz ribbon Methods Samples of mylonite rock were cut perpendicular to the shear fabric of the mylonite, and parallel to the planes of fluid inclusions; this would allow us to analysize several inclusions within the hydrofracture. One side off each sample was polished, then attached to glass slides using Crystalbond (which is soluble in acetone). The samples were trimmed using a rock saw. The cut side was then polished. After this, they were taken off the glass side by dissolving the Crystalbond in acetone and cut into sections that had prominent quartz bands in them. These sections were put into boxes and labeled. The sections were looked at under a polarizing microscope (Fig. 3) to look for fluid inclusions along the same plane. After they were found, they were photographed and labeled, so that they could be found later (Fig. 4). The samples were placed on a heating stage (Fig. 3), and the individual inclusions were located to determine their minimum trapping temperatures. The samples were heated up until the gas bubble trapped inside the inclusion disappeared. It is difficult to tell exactly when the gas bubble disappears in many inclusions because the trapped gas bubbles continuously shrink as temperature goes up. This makes telling when the bubble disappears difficult. To overcome this difficulty, each sample was put through a cooling and heating cycle. Once the bubble was no longer observed, the sampled was cooled. If the bubble reappeared suddenly after cooing of about 20˚C, then the bubble had been fully homogenized at the highest temperature experienced. If, on the other hand, the bubble reappeared after only a few degrees of cooling and simply grew, then the bubble had not been homogenized and the cycle was repeated. This cycling was continued until a precise minimum trapping temperature of the fluid inclusion was determined. Even with the cycling protocol, the margin of error using this method is a few degrees. Fluid inclusions with vapor bubble Fig. 3 Heating stage on petrographic microscope. Isochore plot: The minimum trapping temperature corresponds to the density of the fluid trapped in each inclusion. The density of the fluid within the inclusions is constant regardless of temperature, because the inclusions have a constant volume and mass of water. The isochores (Fig. 5) represent the pressure and temperature for water of different densities and thus different minimum trapping temperatures. The fluid must have been trapped along an isochore line. For example, a fracture may have formed when the rock was at a confining pressure of 350 MPa and a temperature of 350˚C (point A in Fig. 5). When the fracture healed, the fluid was trapped. As the rock was cooled and uplifted, the conditions within the fluid inclusion followed the isochore to the boiling curve (point B). Thus, heating the inclusion from room temperature (point C) moves it to the right, along the boiling curve. As the fluid warms, the bubble shrinks until it reaches it homogenization temperature (point B), at which point the bubble disappears. This is also the minimum trapping temperature (point B). It is a minimum temperature because the homogenization may have actually occurred anywhere along the isochore line. Fig. 6 Frequency plot of minimum trapping temperatures Fig. 5 Pressure-Temperature plot showing isochores for pure water. Results Minimum trapping temperatures for these fluid inclusions range from 152 to 270˚C with an average of 210˚C (Fig. 6). These results imply the hydrothermal fluids moving through the rock at the time of hydrofracturing had an average minimum temperature of 210˚C. To place these data on the isochore plot, we assumed the fluids were pure water (Fig. 7). We could not determine the salinity of the fluids because the inclusions were too small to observe the necessary crystal formation upon cooling. In addition, while these data provide a range of temperatures and pressure for trapping, the pressure could not beconstrained. Interpretation The conditions of hydrothermal microfracturing can be constrained by the isochores corresponding to the minimum trapping temperatures and by the conditions at which the shear zone formed (Fig. 7). The hydrofracturing occurred after the shear zone formed, as indicated by the observation that the fluid inclusion trails cut across the quartz ribbons in the shear zone. The temperature range during the shear zone formation is estimated from the chemistry of the two feldspars recrystallized in the shear zone matrix, and is consistent with the quartz microstructures (Gleason and DeSisto, in review). The lower pressure limit is estimated by assuming 250 MPa is required for suppressing brittle failure during shear zone formation. The upper pressure limit is that of the maximum metamorphic conditions for the gneiss in this part of the Adirondacks (Darling et al., 2004). As the rocks of the Adirondacks cooled and were uplifted to their current elevation, they had to have passed through each of the shaded regions in Figure 7. This path is a counter-clockwise pressure-temperature path consistent with Darling et al. (2004), as well as with many other studies. Fig. 7 Pressure-Temperature plot with isochores for the minimum trapping temperatures of the fluid inclusions and conditions of hydrofracturing. • References: • Darling, R.S., Florence, F.P., Lester, G.W., and Whitney, P.R., 2004, Petrogenesis of prismatine-bearing metapelitic gneisses along the Moose River, west-central Adirondacks, New York, in Tollo, R.P., Corriveau, L., McLelland, J., and Bartholomew, M.J., eds., Proterozoic tectonic evolution of the Grenville orogen in North America: Boulder, Colorado, Geological Society of America Memoir 197, 325-336. • Gleason, G.C., and DeSisto, S., in review, A natural example of crystal-plastic deformation enhancing the incorporation of water into quartz. • Whitney, P.R., Fakundiny, R.H., and Isachsen, Y.W. 2002. Bedrock Geology of the Fulton Chain-of-Lakes Area, west central Adirondack Mountains, New York. New York State Museum Map and chart series no. 44, 124 pp.