Download
1 / 97
970 likes | 1.18k Views
CLOSING THE ACHIEVEMENT GAP. University of the State of New York Albany, NY November, 2005. Every year, thousands of children head toward school already behind. 2005 NAEP Grade 4 Reading All Students, Nation.

E N D
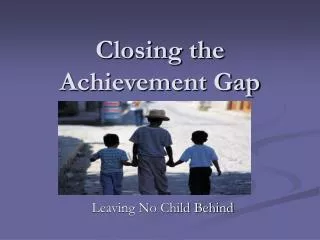
CLOSING THE ACHIEVEMENT GAP University of the State of New York Albany, NY November, 2005
Every year, thousands of children head toward school already behind.
2005 NAEP Grade 4 ReadingAll Students, Nation Source: National Center for Education Statistics, NAEP Data Explorer, http://nces.ed.gov/nationsreportcard/nde/
2005 NAEP Grade 4 Readingby Race/Ethnicity, Nation Source: National Center for Education Statistics, NAEP Data Explorer, http://nces.ed.gov/nationsreportcard/nde/
2005 NAEP Grade 4 Readingby Family Income, Nation Source: National Center for Education Statistics, NAEP Data Explorer, http://nces.ed.gov/nationsreportcard/nde/
Sadly, rather than organizing our educational system to ameliorate this problem, we organize it to exacerbate the problem.
How? By giving students who arrive with less, less in school, too.
Some of these “lesses” are a result of choices that policymakers make.
New York State: Huge Inequities in State and Local Revenue Per Student Source: The Funding Gap, 2004, by Kevin Carey. Data are for 2002
Even at the higher education level, we spend less per student in the institutions where most low-income students start. Source: NCES Digest of Education Statistics, 2003
But some of these “lesses” are a function of choices that we educators make.
Students in Poor Schools Receive ‘A’s for Work That Would Earn ‘Cs’ in Affluent Schools Source: Prospects (ABT Associates, 1993), in “Prospects: Final Report on Student Outcomes”, PES, DOE, 1997.
Fewer Latino students are enrolledin Algebra 2 Source: CCSSO, State Indicators of Science and Mathematics Education, 2001
Math and Science Classes of Mostly Minority Students Are More Often Taught by Misassigned Teachers Source: Jeannie Oakes. Multiplying Inequalities: The Effects of Race, Social Class, and Tracking on Opportunities to Learn Mathematics and Science (Rand: 1990)
Poor and Minority Students Get More Inexperienced* Teachers *Teachers with 3 or fewer years of experience. “High” and “low” refer to top and bottom quartiles. Source: National Center for Education Statistics, “Monitoring Quality: An Indicators Report,” December 2000.
New York State: Low Income Students 4 Times as Likely to be Taught by Teachers Not Certified in Any of their Current Assignments Lankford, Loeb and Wykoff. “Teacher Sorting and the Plight of Urban Schools: A Descriptive Analysis.” 2002
New York State: Minority Students 3 Times as Likely to be Taught by Teachers Who Failed Licensure Exams at Least Once Lankford, Loeb and Wykoff. “Teacher Sorting and the Plight of Urban Schools: A Descriptive Analysis.” 2002
Results are devastating. Kids who come in a little behind, leave a lot behind.
African American and Latino 17 Year-Olds Do Math at Same Levels As White 13 Year-Olds
African American and Latino 17 Year-Olds Read at Same Levels As White 13 Year-Olds
These patterns are reflected, too, in high school completion, college entry and college graduation rates.
Students Graduate From High School At Different Rates, 2001** 4-Year Graduation Rates Source: Jay P. Greene and Greg Forster, “Public High School Graduation and College Readiness Rates in the United States,” Manhattan Institute for Policy Research, September 2003.
Of Every 100 White Kindergartners: (25-to 29-Year-Olds) Source: US Department of Commerce, Bureau of the Census. March Current Population Surveys, 1971-2001, in The Condition of Education 2002.
Of Every 100 African American Kindergartners: (25-to 29-Year-Olds) Source: US Department of Commerce, Bureau of the Census. March Current Population Survey, 1971-2001, In The Condition of Education 2002.
Of Every 100 Latino Kindergartners: (25-to 29-Year-Olds) Source: US Department of Commerce, Bureau of the Census. March Current Population Surveys, 1971-2001, In The condition of Education 2002.
Of Every 100 American Indian/Alaskan Native Kindergartners: (24 Year Olds)
College Graduates by Age 26 Source: Tom Mortenson, Post Secondary Opportunity, 2004.
These patterns are part—but by no means all—of the reason why we are falling behind other developed countries.
US 15 Year-Olds Rank Near Middle Of The Pack Among 32 Participating Countries: 1999
2003: U.S. Ranked 24th out of 29 OECD Countries in Mathematics Source: Organization for Economic Cooperation and Development (OECD), PISA 2003 Results, data available at http://www.oecd.org/
Problems are not limited to our high-poverty and high-minority schools . . .
U.S. Ranks Low in the Percent of Students in the Highest Achievement Level (Level 6) in Math Source: Organization for Economic Cooperation and Development (OECD), PISA 2003 Results, data available at http://www.oecd.org/
U.S. Ranks 23rd out of 29 OECD Countries in the Math Achievement of the Highest-Performing Students* * Students at the 95th Percentile Source: Organization for Economic Cooperation and Development (OECD), PISA 2003 Results, data available at http://www.oecd.org/
U.S. Ranks 23rd out of 29OECD Countries in the Math Achievement of High-SES Students Source: Organization for Economic Cooperation and Development (OECD), PISA 2003 Results, data available at http://www.oecd.org/
2003 PISA Problem-Solving Results: US #23 Source: OECD, PISA. Problem Solving for Today’s World. 2004
55% of our 15 year olds at problem-solving level 1 or below. Closest other country? LATVIA
Performance Of U.S.15 Year-Olds Highly Variable *Of 27 OECD countries Source: OECD, Knowledge and Skills for Life: First Results From PISA 2000, 2001.
But don’t we “make it up by having the best higher education system in the world” and “sending far more of our young people to college” than anybody else?
Education Attainment: Then and Now 1970s 2003 Tertiary Completion* #1 #7 OECD-Education at a Glance (Sept 2005)
College Graduates Last Year China 2.5 million India 2.3 million US 1.3 million