Download
1 / 32
320 likes | 590 Views
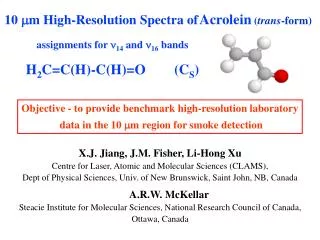
10 m m High-Resolution Spectra of Acrolein ( trans -form) assignments for n 14 and n 16 bands H 2 C=C(H)-C(H)=O (C S ). Objective - to provide benchmark high-resolution laboratory data in the 10 m m region for smoke detection. X.J. Jiang, J.M. Fisher, Li-Hong Xu

E N D
10 mm High-Resolution Spectra ofAcrolein(trans-form) assignments for n14 and n16 bands H2C=C(H)-C(H)=O(CS) Objective - to provide benchmark high-resolution laboratory data in the 10 mm region for smoke detection X.J. Jiang, J.M. Fisher, Li-Hong Xu Centre for Laser, Atomic and Molecular Sciences (CLAMS), Dept of Physical Sciences, Univ. of New Brunswick, Saint John, NB, Canada A.R.W. McKellar Steacie Institute for Molecular Sciences, National Research Council of Canada, Ottawa, Canada
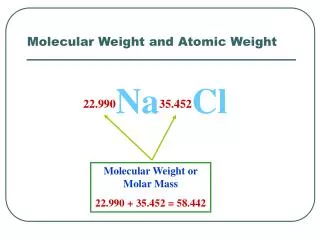
AcroleinH2C=C(H)-C(H)=O Cs symmetry trans-form Eelec. = -191.9742621 (Hartree) cis-form Eelec. = -191.9707933 (Hartree) DEele ~ 760 cm-1 1 Hartree = 219474cm-1 Based on ab initio calculation at B3LYP/6-311++G** using Gaussian03
Introduction - environmental and health concerns • Acrolein plays an important role in pollution and is listed in US-EPA 188Hazardous Air Pollutants (HAPs) • It is one of the priority mobile air toxics(Acetaldehyde, Acrolein, Benzene, 1,3-Butadiene, Formaldehyde, Diesel Particulate Matter + Diesel Exhaust Organic GasSource: J. Wilson, FHWA Air Toxics Workshop, Chicago, IL, May 12, 2003 • It is principally used as a chemical intermediate in the production of acrylic acid and its esters • Combustion of fossil fuels and tobacco smoke contribute to the environmental prevalence of acrolein
GC-MS MS-MS Proton Transfer MS FTIR (low resolution IR) Open path atmospheric P Tunable Infrared Laser DifferentialAbsorption Spectroscopy (TILDAS) Extractive sampling, low P Continuous High Speed < 1 s High Resolution High Sensitivity Absolute Concentrations Sub-List of HAPs Most Applicable to TILDAS Detection Methods - Acetaldehyde * - Acrolein * - Acrylonitrile - 1-3 Butadiene * - Benzene - Carbonyl Sulfide - Ethylene Oxide - Formaldehyde - Formic Acid - Hydrazine - Methanol * * currently targeted molecules Hazardous Air Pollutants (HAP) Detection Methods Aerodyne Research, Inc. & Philip Morris Research Center, VA. High resolution data are needed, and are not yet available in literature
Vibrational modes of acrolein (trans-form) A’ Description Obs (cm-1) n1 =CH2 a-str 3103 n2 CH* str 3069 n3 =CH2 s-str 2998 n4 CH** str 2800 n5 C=O str 1742 n6 C=C str 1625 n7 =CH2 sci 1420 n8 CH** bend 1360 A” Description Obs (cm-1) n9 CH* bend 1275 n14 =CH2 twist 993 n10 C-C str 1158 n15 CH** o/p 972 n11 =CH2 i/p 912 n16 =CH2 o/p 959 n12 CCO bend 564 n17 CH* o/p 593 n13 CCC bend 324 n18 C-C tor 158 Vib. degrees of freedom: 3x8 - 3T - 3R = 18 * ** Ref. Y. Hamada, Y. Nishimura, M. Tsuboi, Chem. Phys.100 (1985) 365-375.
Survey spectrum of Acrolein - Pacific Northwest National Laboratory
Acrolein(trans-form): High Resolution Spectroscopy • Low energy trans-form has been studied extensively by microwave spectroscopy; • No previous high-resolution studies exist for the 10 mm region; • High-resolution FTIR spectra have been recorded at the National Research Council of Canada from 800 – 1100 cm-1 @ 0.002 cm-1 resolution at room and cooled temp. Spectrum I: 295K, 30 cm multi-pass cell set to 4 transits, ~500 mTorr Spectrum II: 180K, 2 m multi-pass cell set to 4 transits, ~60 mTorr cover at least the n11 (A' CH2 rocking, in-plane), 912 cm-1n16 (A" CH2 wagging, out-of-plane) 959 cm-1n14 (A" CH2 twisting) 993 cm-1 • Rotational analyses of the n16andn14 bands – both c-typesare reported here.
Acrolein – Low Resolution Plot – n11, n16, n14 modes Room Temp. qQ qQ n16 A" c-type CH2 wagging o/p n14 A" c-type CH2 twisting n11 A' b-type CH2 rocking i/p rQKa"® ¬ pQKa" rQKa"® ¬ pQKa"
Acrolein – Medium Resolution Plot – n14 & n16 Bands n14 CH2 twisting n16 CH2 rocking o/p rQKa" pQKa" rQKa" pQKa" n16 Ka” 2 3 4 5 6 7 8 9 n14Ka” 1 2 3 4 5 6 7 9 8 7 6 5 4 3 rQ of n16 and pQ of n14 overlap to some extent
¬ n 3 4 P 16 ¬ n 4 5 P 16 ¬ n 5 6 P 16 ¬ n 3 4 P 14 ¬ n 5 6 P 14 ¬ n 4 3 R 16 ¬ n 5 4 R 16 ¬ n 3 2 R 16 High Resolution Display P25 P23 P24 P17 P16 P15 P14 n16pP P8 P7 P6 941.0 941.1 941.2 941.3 941.4 941.5 941.6 941.7 941.8 941.9 942.0 942.1 n14pP P27 P26 P29 P28 P6 P9 P8 P7 n166 ¬5Q n16 2 ¬1R271,27 R16 R17 R19 R18 R8 R6 R7 R9 n16rR R26 R27 R25 974.0 974.1 974.2 974.3 974.4 974.5 974.6 974.7 974.8 974.9 975.0 975.1 Wavenumber (cm-1)
Modeling – Watson Asymmetric Rotor Hamiltonian (isolated band approach) • n18 (ground state): -270 MW transitions were previously measured in the literature. - They were refitted for refined ground state parameters. • n16(A'' CH2 out-of-plane wagging): - Upper states have been identified forKa' = 0 to 10. - Small asymmetry splittings for Ka' < 5 have been observed. - The band has been modeled by a Watson asymmetric rotor Hamiltonian with Ka’ = 7 and 8 excluded. • n14(A'' CH2 twisting): - Upper states have been identified forKa' = 1 to 9. - Small asymmetry splittings for Ka' < 5 have been observed. - The band has been modeled by a Watson asymmetric rotor Hamiltonian with Ka’ = 1-3 excluded.
Molecular Parameters Ground Statean16 (CH2 wagging) n14 (CH2 twisting) nvib0.0 958.74075(11) 992.65739(69) A1.57954994(15)1.596714(10) 1.570188(54) B0.1554241692(67) 0.15529624(80) 0.155220(16) C0.1415208986(73) 0.14152245(82) 0.141938(19) DKx1051.2023(16) 2.506(26) 0.76(13) DJKx106-0.292890(96) -0.286(13) 1.058(63) DJx107 0.34750(12) 0.3543(31) dJx1080.39988(35) 0.458(30) dKx1050.0193(89) 0.1026(76) -1.000(19) HK x107 -0.137(19) -0.385(95) HKJ x108-0.001594(34) -0.571(10) 1.688(50) HJK x1010-0.0029(18) -0.146(69) # of lines 270 962 (Ka’=7,8 excluded) 552 (Ka’=1-3 excluded) RMS 0.017 MHz 0.0010 cm-1 0.0013 cm-1 a Ground state parameters have been converted to cm-1 for ready comparison.
J-Reduced Energy Diagram n16 Ka 10 9 8 7 6 5 4 3 2 1/0 (cm-1) n14 Ka 9 8 7 6 5 4 3 2 1 J values
Summary and Future • To a large extent, the n16 (A")c-type CH2 out-of-plane waggingband (959cm-1) and n14 (A") c-type CH2 twisting band (993 cm-1) can be modeled by a Watson asymmetric rotor Hamiltonian, treating each state separately with some subbands excluded (we believe states excluded are perturbed); • We plan to carry out analysis for the n11 (A’) CH2 in-plane rocking mode (912 cm-1) next, as state interactions are expected between n11, n16 and n14. Indeed, we have observed some irregular J and K patterns in n16 and n14. In order to treat the spectra properly, it might be helpful to use an interacting band model; • We have just started to model the n14 and n16 states simultaneously with inclusion of symmetry allowed terms between the n14 and n16. • In future, further low temp FTIR spectra would be really helpful with the new Bruker IFS125 HR FTS (0.0009 cm-1 unapodized max. res.) at the Canadian Light Source in Saskatoon. Acknowledgements: financial support from NSERC; thanks to Dr. M.S. Zahniser at Aerodyne Research, Inc., for bringing up this interesting subject of study.
Line Intensity Calculation Ab initio Dipole Derivative Calculation e: Nuclear spin statistical weight nij: Transition frequency : Loschmidt’s number T: Temperature Z: Partition functions (vib, tors,rot) |<m>|2: Transition moment - vibrational A: Honl-London factor – rot. overlap • Structure & frequency calculation with Gaussian 03 at B3LYP/6-311++G** - Eigenvectors (displacements) for each normal mode(standard orientation, normalized, not orthogonal): multiplied by (mrd_n)1/2Þ PAM • - Dipole derivative (in z-matrix orientation) Þ PAM • - Dipole derivatives for each normal mode in PAM system (n = 1 to 3N-6) (g = x, y, z)
Vibrational modes of acrolein (trans-form) A’ Description Obs (cm-1) n1 =CH2 a-str 3103 n2 CH* str 3069 n3 =CH2 s-str 2998 n4 CH** str 2800 n5 C=O str 1742 n6 C=C str 1625 n7 =CH2 sci 1420 n8 CH** bend 1360 A” Description Obs (cm-1) n9 CH* bend 1275 n14 =CH2 twist 993 n10 C-C str 1158 n15 CH** o/p 972 n11 =CH2 i/p 912 n16 =CH2 o/p 959 n12 CCO bend 564 n17 CH* o/p 593 n13 CCC bend 324 n18 C-C tor 158 High-resolution FTIR spectra have also been recorded at NRC in FIR region Convering: Low frequency vibrations and n18 hot band Analysis is in progress - A.R.W. McKellar NRC Ref. Y. Hamada, Y. Nishimura, M. Tsuboi, Chem. Phys.100 (1985) 365-375.
10 mm High-Resolution Spectra of1,3-Butadiene H2C=C(H)-C(H)=CH2 (C2h) Acrolein H2C=C(H)-C(H)=O (CS) Objective - to provide and extend benchmark high-resolution laboratory data for the two molecules in the 10 mm region Li-Hong Xu, X.J. Jiang, J. Fisher, Z.D. Sun, R.M. Lees Centre for Laser, Atomic and Molecular Sciences (CLAMS), Dept of Physical Sciences, Univ. of New Brunswick, Saint John, NB, Canada N.C. Craig A.R.W. McKellar Dept. of Chemistry, Steacie Institute for Molecular Sciences, Oberlin College, National Research Council of Canada, Ohio, U.S.A. Ottawa, Canada
1,3-ButadieneH2C=C(H)-C(H)=CH2 C2h symmetry • Lower energy planar trans-form belongs to the C2h symmetry group. • Normal isotopic species is non-polar, prohibiting traditional MW spectroscopy. • 1,3-Butadiene, n11 (au) CH2 wagging mode - centred in 11 mm region - FTIR spectrum has been recorded in Giessen at 0.00186 cm-1 (~60 MHz) resolution and rotationally analyzed by N.C. Craig et al.,J. Mol. Struct.695-696 (2004) 59-69. - Many medium and low JQ-branch component lines are not resolved in the Doppler limited Fourier transform spectra. - We have applied the saturation Lamb-dip technique (~200 kHz) to the present case (using CO2/MWSB). Several rQ-branches have been completely resolved. - For intensity information, a line list with position and intensity has been compiled using ab initio dipole derivative & rotational constants from high resol'n analysis,Z.D. Sun et al., J. Mol. Struct.742 (2005) 69-76.
with our sub-Doppler tech. overlapped features – resolved Ka = 7 ¬ 6 Q-branch 840 860 880 900 920 940 960 cm-1 923.12 .14 .16 .18 .20 .22 1,3-ButadieneH2C=C(H)-C(H)=CH2 • used in the production of rubber and plastics. • detected in ambient air (released from motor vehicle exhaust) - 0.3 ppb. • expected in the cigarette smoke matrix (1 of the 4 target molecules in 2004). • at Aerodyne Research Inc. & Philip Morris Research Center, quantum cascade laser system is commissioned– reliance on lab benchmark database. > 10 lines Giessen FTIR at 0.00186 cm-1(~60 MHz) resolution N.C. Craig et al., J. Mol. Struct. 695-696 (2004) 59-69.
Optical Table Layout 1 mW Tunable IR SB 15W MW 8W CO2 laser
MW frequency sweeping Data acquisition OCS in 0.6-m multipass cell (static) Ratio (3x) F-P PZT voltage tuning Sample Background Frequency Sweeping, PZT Tuning & Data Acquisition Saturation Lamb-dip experiments @ sub-Doppler resolution (~ 200 kHz) Methanol (CH3OH), OCS, Butadiene (C4H6) in collaboration with colleagues in NNOV-Russia
Ka = 7 ¬ 6 Q branch 10P(42) + SB 922.914293 cm-1 (Ka+Kc = J ¬ Ka+Kc = J+1) J LDO LDO FTS O-C LDO O-C D MHz cm-1 cm-1 MHz MHz MHz MHz 7 9668.64 923.236804 5.38 8 9638.97 923.235815 5.21 9 9604.94 923.234680 5.09 10 9566.22 923.233388 4.95 11 9522.58 923.231932 4.87 12 9473.55 923.230297 4.71 13 9418.75 923.228469 4.41 14 9358.03 923.226444 4.19 15 9290.98 923.224207 4.05 16 9216.79 923.221732 3.61 17 9135.46 923.219019 923.219410 3.37 18 9046.38 923.216048 923.216096 3.18 19 8949.01 923.212800 923.212837 3.00 20 8842.65 923.209252 923.209270 2.74 21 8726.84 923.205389 923.205322 2.47 22 8601.08 923.201194 923.201094 2.29 23 8464.56 923.196641 923.196657 2.09 24 8316.60 923.191705 923.191976 1.84 25 8156.48 923.186364 923.186381 1.48 (Ka+Kc = J+1 ¬ Ka+Kc = J) 26 7983.64 923.180599 923.180423 1.23 27 7797.45923.174388 923.174366 1.18 7797.031.21 0.42 28 7596.73923.167693 923.167702 0.99 7596.071.02 0.66 29 7380.82923.160491 923.160603 0.78 7379.760.77 1.06 30 7148.85923.152753 923.152763 0.55 7147.260.55 1.59 small D splittings have been observed Lamb-Dip Measurements - Completely Resolved Q-Branches
(n = 1 to 15) (g and k = x, y, z) Ab initio Dipole Derivative for the n11 Band of BDE • Structure & frequency calculation with Gaussian 03 at B3LYP/6-311++G** • Ab initio frequency calculation gives: • - Eigenvectors for each normal mode(standard orientation, normalized, not orthogonal): multiplied by (mrd_n)1/2Þ PAM • - Dipole derivative in z-matrix orientation:Þ PAM • - Dipole derivatives for each normal mode in PAM system Ab initio results for 4 Au modesn11 Harmonic Frequencies (cm-1) 172.39 534.49 937.36 1051.21IR Intensities (km/mol) 0.6983 14.2316 95.8243 36.8438 dmC/dQ (Debye) 0.02676 -0.1208 -0.3135 -0.1944sum(dm/dQ)2 * cvt 0.6982 14.2313 95.8172 36.8419 Ab initio output Our calc
Acrolein J-Reduced Energy Diagram (cm-1) K’=7 n16 K’=5 n14 K’=4 n14 K’=6 n16 K’=3 n14 K’=2 n14 K’=5 n16 K’=1 n14 K’=4 n16 J value
Acrolein J-Reduced Energy Diagram (Calculated) Our hi-resolution analyses of n16 and n14 bands have revealed several possible perturbations. Interaction partners are yet to be identified. This diagram shows possible interaction pairs between nearby vibrational states. Calculated J-Reduced Energy (cm-1) n14 CH2 twist n14 CH2 twist n16 CH2 wag o/p n11 CH2 rock i/p n15 CH** wag o/p n15 CH** wag o/p n16 CH2 wag o/p n11 CH2 rock i/p K value
US-EPA 188 Hazardous Air Pollutants (HAPs) National Air Toxics Assessment 32-Compound Sub-list in red
“Pseudo” line lists from TDL spectra: Acrolein (Offset 0.02) “SELECTLINES.EXE” with “MULTIPEAKFIT” Harward et al., TDLS 2005 For better intensity information from the hi-resolution spectra by “scaling” to the low resolution TDL spectra where intensity information is known accurately.
Acrolein Detection Scheme High resolution FTIR Spectrum obtained from NRC (scaled to low TDL od spectra) Linestrengths from Harward et al. (2005), scaled to 76 m, 1 ppb, 50 Torr Abs max: 3x10⁻⁵ Strongest features at 958 cm-1 with atmospheric background CO2, H2O Background subtracted spectrum with Ethylene, 1 ppb Acrolein Detection limit: 0.4 ppb (2s, 60 s)
Cigarette Smoke Analysis Sidestream Mainstream Shi et al., Anal. Chem. 2003
Cigarette Smoke Analysis with QCLs mg/cigarette main side NH3 0.001 6.0 C2H4 0.25 1.6 NO 0.28 1.8 CO2 43 450
Acrolein Cigarette Smoke (TDL Spectra) 1-3 BUTADIENE 12 mg/cigarette Puff-by-Puff Mass (grams) ACROLEIN IN SMOKE MATRIX (TDL) ACROLEIN 15 mg/cigarette Ref: Harward, Thweatt, Parrish; TDLS 2005