Download
1 / 12
120 likes | 150 Views
Explore the use of student-generated and technology-generated data representations for meaningful discussions. Learn to interpret data using dot plots, histograms, and more. Utilize NCTM standards for grades 3-5 and engage in technology-driven activities to foster mathematical exploration and understanding.

E N D
Making Meaning of Data Analysis Christine Browning & Gina Garza-Kling Western Michigan University
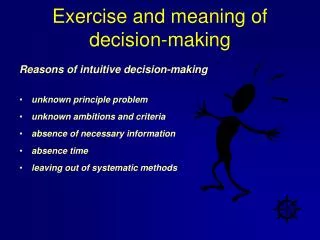
Two Main Ideas • Using student-generated representations of data to drive discussion. • Using technology-generated representations to extend discussion.
Some Numerical Displays • Dot plots • Histograms • Interval lengths • Same interval lengths • Spaces in between intervals • Size of intervals; how many • Other
Data Analysis and Probability Standard from the NCTM Principles and Standards for School Mathematics • In grades 3-5 all students should- • recognize the differences in representing categorical and numerical data • compare different representations of the same data and evaluate how well each representation shows important aspects of the data. • (NCTM, 176)
Student Comments on CreatingTheir Own Displays for Data • I really like how we made our own types of graphs, and then discussed things about them together as a class. It really helped me learn now to do things correctly, and I learned from my mistakes and my classmates mistakes as well.
I have really learned a lot more about graphs and which is better for certain types of problems/data. Allowing us to create the representations and then progress to group feedback/discussion is a great method. I do not really like when teachers show you first. It does not show the teacher what the students may already know and where to go from there.
I absolutely love the style of teaching in this course. Having us make our own graphs brings somuch more conversation to the classroom. More questions come up that I feel would never come to topic had we been given the “correct” graph. This brings a deeper understanding to the material because we are learning what not to do as well- or in other words learning from our mistakes in a positive way
Thinking on Technology • Why use technology-generated displays? • When do we use them? • What displays to use?
Why? • Activities that engage students in connecting multiple representations (e.g., graphical, numerical, algebraic and verbal), and those that invite students to analyze or create images, visualizations, and simulations provide wide-ranging opportunities for mathematical exploration and sense-making Technology Position Statement (Association of Mathematics Teacher Educators, 2006)
When? • 65 78 70 78 88 68 73 102 72 61 54 84 82 65 97 79 81 73 63 74 70 56 75 79 67 68 75 82 74 73 86 77 68 65 78 70 78 88 68 73 102 72 61 54 84 82 65 97 79 81 73 63 74 70 56 75 79 67 68 75 82 74 73 86 77
Technology, Pedagogy, & Content Knowledge • TPCK was presented as the interconnection and intersection of content, pedagogy (teaching and student learning), and technology (Margerum-Leys & Marx, 2002; Mishra, & Koehler, 2006; Niess, 2005; Pierson, 2001). • TPCK has, over time, been recast as TPACK, or the total package required for integrating technology, pedagogy, and content knowledge (Niess, 2008; Thompson & Mishra, 2007).