Understanding Demand: Factors and Curves in Economics
Learn about demand, quantity demanded, demand curve, determinants like income and prices of goods, and relationships between products in economics. Explore substitutes, complements, and unrelated goods.


Understanding Demand: Factors and Curves in Economics
E N D
Presentation Transcript
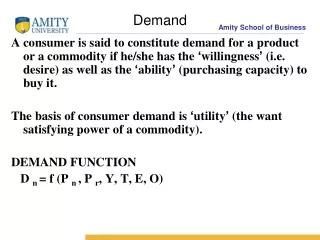
Demand is defined as the quantity of a good or service consumers are able and willing to buy at a given price in a given time period.
Quantity demanded : amount of good or service that buyers desire to purchase at a particular price during some period. • Quantity demanded changes according to the price. • Quantity demanded is basically a point on the demand curve, while demand is the actual curve.
The quantity demanded must include a specific time period in order to be meaningful. • For example, if it simply says, "a consumer will buy a CD for $10," it means nothing. We only know if the demand is large or small if the time period is mentioned; for instance, "a consumer will buy a CD every week for $10." • The downward slope of the curve reflects the law of demand.
Determinants on Demand Income • There are two types of products to consider when we are attempting to understand how a change in income affects the demand for a product. These are normal and inferior goods.
Normal goods • For most goods, as income rises, the demand for the product will also rise. Such goods are known as normal goods. • As income rises, the demand curve for a normal good will shift to the right. The size of the shift in demand will depend upon the good itself. • An increase in income may cause a small shift to the right in the demand curve for salt, but a larger increase in the demand for theatre tickets.
The demand curve for air travel is shown in Figure 3.2. In this case, an increase in income shifts the demand curve for air travel to the right, so more air travel is demanded at every price.
Inferior goods • If a product is considered to be inferior, then demand for the product will fall as income rises and the consumer starts to buy higher priced substitutes in place of the inferior good. • Examples of inferior goods may be cheap wine or “own brand” supermarket detergents.
As income rises, the demand curve for the inferior good will shift to the left. • When income gets to a certain level, the consumer will be buying only the higher priced goods and the demand for the inferior good will become zero. • And so the demand curve will disappear.
The price of other products • There are three possible relationships between products. • They may be substitutes for each other, complements to each other, or unrelated.
Substitutes • If products are substitutes for each other, then a change in the price of one of the products will lead to a change in the demand for the other product. • For example, if there is a fall in the price of chicken in an economy, then there will be an increase in the quantity demanded of chicken and a fall in the demand for beef, which is a substitute.
This would lead to a movement along the demand curve for chicken and a shift to the left of the demand curve for beef.
A fall in the price of chicken from p to Pi leads to an increase in the quantity demanded of chicken from q to q1. This change in the price of a substitute means that some consumers will switch from buying beef to buying chicken and there will be a fall in the demand for beef, at all prices, and the demand curve will shift to the left from D to D1. Even though the price of beef has not changed, there is a fall in demand from q to q1.
In the same way, an increase in the price of a substitute product will lead to a fall in the quantity demanded of that product and an increase in demand (shift of the demand curve to the right) for the substitutes whose prices have not changed.
Complements • Complements are products that are often purchased together, such as printers and ink cartridges. If products are complements to each other, then a change in the price of one of the products will lead to a change in the demand for the other product. • For example, if there is a fall in the price of DVD players in an economy, then there will be an increase in the quantity demanded of DVD players and an increase in the demand for DVDs, which are a complement.
This would lead to a movement along the demand curve for DVD players and a shift to the right of the demand curve for DVDs.
As we can see, a fall in the price of DVD players from p to Pi leads to an increase in the quantity demanded of players from q to q1. This change in the price of a complement means that some consumers will now buy more DVDs to go with the additional DVD players that they are buying and there will be an increase in the demand for DVD5, at all prices, and the demand curve will shift to the right from D to D1. Even though the price of DVDs has not changed, there is an increase in demand from q to q1.
Unrelated goods • If products are unrelated, then a change in the price of one product will have no effect upon the demand for the other product. • For example, an increase in the price of toilet paper will have no effect upon the demand for pencils. • We say that the two products are unrelated.
Tastes • Realize that marketing may alter tastes and that firms attempt to influence tastes so that they can shift the demand curve for their product to the right. • A change in tastes in favor of a product will lead to more being demanded at every price.
The demand curve for skateboards is shown in Figure 3.5. If there is an advertising campaign to encourage the purchase of skateboards, or if the world skateboarding championships are televised and this leads to more people wishing to skateboard, then there will be a shift of the demand curve for skateboards to the right. This means that more skateboards will be demanded at every price
Other Factors • The size of the population: • If the population begins to grow, then it is logical to assume that the demand for most products will increase and that their demand curves will start to shift to the right.
Change in the age structure of the population • If the age structure of the economy starts to alter, then this will affect the demand for certain products. • For example, if the percentage of older people in an economy starts to increase, then there may be an increase in the demand for walking frames and the demand for them would shift to the right. • At the same time, there may be a fall in demand for skateboards and the demand curve would shift to the left.
Changes in income distribution • If there is a change in the distribution of income, such that the relatively poor are better off and the rich slightly worse off, then there may be an increase in the demand for basic necessity goods, such as meat, and a subsequent shift of the demand curve for meat to the right.
Government policy changes • Changes in direct taxes, i.e. taxes on incomes, may affect the money that people have to spend, and thus their demand. • Also, government policies such as compulsory seat belts, compulsory wearing of bicycle helmets, or a ban on smoking in public places, would all affect demand In the relevant markets.
Seasonal changes • Changes in seasons may lead to changes in the pattern of demand in the economy. • For example, there will be more demand for warm coats in the winter and less demand for swimsuits.
Distinction between a movement along a demand curve and a shift of the demand curve • Sometimes there are movements along the existing demand curve and sometimes the demand curve actually shifts to the left or the right.
A change in the price of the good itself leads to a movement along the existing demand curve, since the price of the good is on one of the axes. This is shown in Figure 3.6, where a fall in the price of soccer boots from p to p1 leads to an increase in the quantity demanded from q to q1.
A change in any of the other determinants of demand will always lead to a shift of the demand curve to either the left or the right. For example, as shown in Figure 3.7, a government policy requiring cyclists to wear safety helmets would lead to a shift to the right of the demand curve for safety helmets from D to D1. As a result more would be demanded at each price and at the existing price of p, demand would increase from q to q1.
Economic terms • Any change in the price will result in an extension (=increase) or contraction (= decrease) in the quantity demand. An increase or decrease in price means a movement along the demand curve. • This is referred to as a change in quantity demand. • Changing the price does not change demand but the quantity demanded.