Download
1 / 14
150 likes | 449 Views
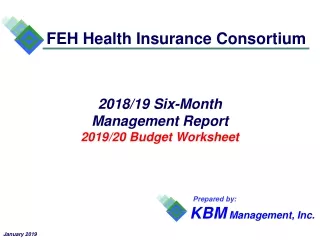
Prepared by:. KBM Management, Inc. FEH Health Insurance Consortium. 2013/14 Six-Month Management Report 2014/15 Budget Worksheet. January 2014. 1. Budget Performance – Projected vs. Actual.

E N D
Prepared by: KBMManagement, Inc. FEH Health Insurance Consortium 2013/14 Six-Month Management Report 2014/15 Budget Worksheet January 2014
1 Budget Performance – Projected vs. Actual The Budget Performancegraph illustrates the difference between the projected costs and actual Plan performance by line item. The Plan has experienced a decrease in census which has contributed to the lower claim costs. The higher revenue is the result of stop-loss payments from the prior year, better prescription drug rebates than anticipated and performance rebates from Excellus. The changing census is also reflected in the lower than anticipated Administration Fees. FEH Health Insurance Consortium KBM Management, Inc.- January 2014
2 Distribution of Revenue The Distribution of Revenuepresents a breakdown of where the money is coming from. More than $0.95 of every $1.00 is provided through premium payments by the component Districts. Total income includes all payments that were received by the Plan in the first six months including a $525,516 in rebates and performance guarantees and $293,049 in stop-loss reimbursement. There also remained a premium receivable of $320,384 at the end of December. Total Revenue = $18,664,040 FEH Health Insurance Consortium KBM Management, Inc.- January 2014
3 Distribution of Expenditures The Distribution of Expenditurespresents a breakdown of money paid out on behalf of the Plan. Nearly $0.94 of every $1.00 paid goes to pay actual claim costs. This loss ratio continues to illustrate the spending efficiency of the self-funded mechanism. Claim Administration includes Excellus retention, stop-loss premium and management fees. Health Care Reform is requiring insurance companies to achieve at least an 85% loss ratio. Total Expenditures = $17,107,364 FEH Health Insurance Consortium KBM Management, Inc.- January 2014
4 Distribution of Fund Balance The Distribution of Fund Balanceshows where fund balance is allocated. The Advance Deposit is held by Excellus to assure payment of claims they have processed and paid prior to billing the Consortium. The IBNR Reserve is necessary for the payment and processing of claims that have been incurred but not reported. The Rate Stabilization may be used to help offset future increases. Fund Balance = $17,114,146 FEH Health Insurance Consortium KBM Management, Inc.- January 2014
5 Projected vs. Paid Claims The following paid claim charts were created using information provided by Excellus Blue Cross Blue Shield of Utica. This Projected vs. Paid Claimsgraph compares the projected claims cost with paid claims reported by BCBS for the 2013/14 plan year. Paid claims are presently 10% below the original projection and 7% below the updated projection. Decreased claims in November and December have pushed claims lower. We anticipate they will move back toward the updated projection through the end of the year. YTD Projections = $17,191,645 YTD Paid Claims = $15,465,646 Updated Projection = $16,641,439 KBM Management, Inc. – January 2014 FEH Health Insurance Consortium
6 Monthly Paid Claims TheMonthly Paid Claimspresents a comparison over the last three plan years. The red line represents the original monthly projected claim amounts. Monthly costs show significant swings down almost $2 million in the second quarter. We anticipate that claim costs will bounce back in the second half as there have not been any major census, benefit or industry changes. KBM Management, Inc. – January 2014 FEH Health Insurance Consortium
7 Distribution of Claims by Service Type The Distribution of Claims by ServiceTypeshows a comparison of the allocation of paid claims for the first six months of this plan year and last. Average costs are up 3.38% compared to historical trends in 8% range. The shift to the separate reporting of the Traditional vs. PPO costs continue to skew the variance. Total census has seen a significant decrease of nearly 135 contracts. KBM Management, Inc. – January 2014 FEH Health Insurance Consortium
8 Paid Claim Comparison by Type of Service The Paid Claim Comparison by Service Type provides the Consortium with a breakout of total costs by each type of service. Claims are actually lower than the two previous plan years through six months. This is not reflective of either past or industry trends. KBM Management, Inc. – January 2014 FEH Health Insurance Consortium
9 Quarterly Cost per Enrollee The Quarterly Cost per Enrolleeis based on average monthly cost during each quarter. The red line represents the average cost trend over the past 3.5 plan years. After the lowest quarter in three years the trend during this period has slipped to near 3%. The long term trend continues to remain above 7%. KBM Management, Inc. – January 2014 FEH Health Insurance Consortium
10 Silverscript Analysis The Silverscript Analysisprovides quarterly prescription drug cost for retirees 65 and older. This chart highlights the subsidies that are received for providing prescription drug coverage to Medicare eligibles through the Silverscript program. The Silverscript program gives the plan access to the Part D brand discounts (orange) and the Federal drug reinsurance (red). These are two discounts that are not available under the traditional CVS/Caremark agreement. The Plan’s second quarter receives the highest return as it represents the fourth quarter of the calendar year. KBM Management, Inc. – January 2014 FEH Health Insurance Consortium
11 Paid Claim Comparison by Type of Service The Paid Claim Comparison by Service Type provides the Consortium with a 14 year breakout of total costs by each type of service. Costs have more than doubled during this period. The trend over the past five years has settled to 4.3% annually. This compares to 8% in the previous five and ten year period. This chart reminds us of the volatility in the plan, particularly after stretches of stability. KBM Management, Inc. – August 2013 FEH Health Insurance Consortium
12 2014/15 Budget with Rx Enhancements KBM Management, Inc. – January 2014 FEH Health Insurance Consortium
13 2014/15 Budget with No Changes KBM Management, Inc. – January 2014 FEH Health Insurance Consortium