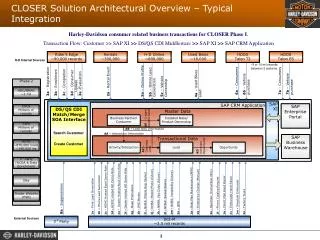
Typical BI solution Architecture
Typical BI solution Architecture. Typical BI Solution Architecture. Admin & Finance Applications. Typical BI Solution Server Topology. DW Design Methodology. DW Design Methodology. Choosing the process Choosing the grain Identifying and confirming the dimensions Choosing the facts


Typical BI solution Architecture
E N D
Presentation Transcript
Typical BI Solution Architecture Admin & Finance Applications
DW Design Methodology Choosing the process Choosing the grain Identifying and confirming the dimensions Choosing the facts Storing pre-calculations in the fact table Rounding out the dimension tables Choosing the duration of the database Tracking slowly changing dimensions Deciding the query priorities and the query modes
9 Steps DW Design Methodology • Step 1: Choosing Process • The chosen process (function) refers to the subject matter of a particular data mart, for example: a Bill Payment Process • Step 2: Choosing The Grain • Decide what a record of the fact table is to represent, i.e.. the grain. For example, the grain is a single Payment • Step 3: Identifying and conforming the dimensions • Dimensions set the context for asking questions about the facts in the fact table. e.g. Who made the Bill Payment • Step 4: Choosing the Facts • Facts should be numeric and additive.
9 Steps DW Design Methodology • Step 5: Storing pre-calculations in the fact table • Once the facts have been selected each should be re-examined to determine whether there are opportunities to use pre-calculations. (denormalization) • Step 6: Rounding out the dimension tables • What properties to include in dimension table to best describe it. Should be intuitive and understandable • Step 7: Choosing the duration of the database • How long to keep the data for
9 Steps DW Design Methodology • Step 8: Tracking slowly changing dimensions • Type 1: where a changed dimension attribute is overwritten • Type 2: where a changed dimension attribute causes a new dimension record to be created • Type 3: where a changed dimension attribute causes an alternate attribute to be created so that both the old and new values of the attribute are simultaneously accessible in the same dimension record • Step 9: Deciding the query priorities and the query modes • Consider physical decision issues • Indexing for performance, Indexed Views, partitioning, physical sort order, etc. • Storage, backup, security
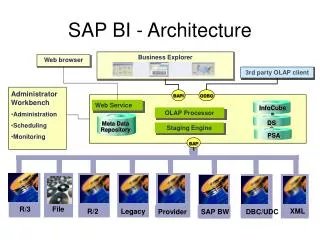
Data Warehouse Architecture Data Warehouse Architecture Source Systems Data Staging Area Data Warehouse Repository Division A Division B Extract, Transformation and Load (ETL) Division C External Data
Data Staging Area • Subject Area Oriented • Data Structure more closely mirrors Operational System Data Layouts • Supports Identification of Changed Data • Acts as a Working Area to Support the Transformation Process
Data Warehouse Repository • Organized around Conformed Dimensions and Facts • Promotes Usability and Intuitiveness • Consolidated and Cross-Functional • Historical and Atomic Representation of Data • Insulated from Source System Modifications and Additions
Time_Dim Shipper_Dim Employee_Dim Product_Dim Customer_Dim ShipperKey EmployeeKey ProductKey TimeKey CustomerKey Sales_Fact EmployeeID . . . CustomerID . . . ShipperID . . . TheDate . . . ProductID . . . TimeKey EmployeeKey ProductKey CustomerKey ShipperKey Required Data (Business Metrics) or (Measures) . . . Typical Star Schema
SSIS Design Best Practices SSIS Design Best Practices
SSIS Best Practices SSIS (SQL Server Integration Services) is the ETL tool from Microsoft BI stack, and we follow Microsoft recommended design best practices. Few of them are listed below • Making the sure the design of staging schema(s) and target DW schema is ready and data mapping document is prepared • Necessary table design best practices to handle high volumes of data. • Using Column names instead ‘*’ to utilize optimal usage of package buffer size which improves performance of the package • Setting the right values for ‘Rows per batch’ and ‘Maximum insert commit size’ whilst loading high volumes of data • Avoiding asynchronous transformations wherever necessary to achieve the maximum benefit of parallel execution tree mechanism of SSIS
SSIS Best Practices • Enable Logging to identify the issues during run time • Incorporating proper error handling mechanism for both dimension and fact loads separately • Usage of ‘Checkpoints’ in the package to resume the execution from the same state of failure in case it happens • Auditing of the packages / Data flow tasks to track the result of package execution and other important attributes • Appropriately using send mail tasks to communicate the package execution status to primary stakeholders
SSIS Best Practices • Using ‘SCD (Slowly Changing Dimensions)’ transformation whilst creating dimension packages to handle the constant changes in the master tables and their maintenance • Using alternative mechanism instead of ‘Look up’ transformation whenever the data volume is high to increase the performance • Using Appropriate incremental loading mechanism for incremental updates to fact tables • Creating the master package, to load all the dimensions in parallel, and sequencing them if necessary to take care of any dependencies and then triggering the fact load packages
SSAS Design Best Practices SSAS Design Best Practices
Design Best Practices for Cube Dimensions • Consolidating multiple hierarchies into single dimension • Avoid ROLAP Storage mode • Use of Parent-Child and many-many relationship dimensions prudently • Design Best Practices for Attributes / Hierarchies • Define all possible attribute relationships • Remove redundant attribute relationships • Use natural hierarchies where possible • Design Best Practices for Measures • Use smallest numeric data type possible • Use semi-additive aggregate functions instead of MDX calculations to achieve same behavior SSAS Best Practices
Creating Partitions if there are more than 20 M rows in the fact table (approx.) • Managing storage settings (MOLAP, HOLAP, ROLAP) by usage patterns • Designing aggregations appropriately by accurately giving the counts for attributes and fact table counts • Writing optimized MDX queries • Learn the data security that the client expects and implement the security • Data level • Role based • Data Mining – Create Mining Structures and add mining models to it. Different models possible are as follows • Classify – decision trees, Neural networks • Forecasting – time series analysis • Shopping basket – shopping basket analysis (generally used in retail to identify which commodities are purchased as a group) SSAS Best Practices
Typical OLAP Cube Design Atlanta Chicago MarketsDimension Denver Grapes Cherries Dallas Melons Product Dimension Apples Q4 Q1 Q2 Q3 TimeDimension
SalesFact Typical OLAP Cube Design Atlanta Chicago MarketsDimension Denver Grapes Cherries Dallas Melons Product Dimension Apples Q4 Q1 Q2 Q3 TimeDimension
Storage Methodology • Relational On-Line Analytical Processing (ROLAP): The information that is stored in the Data Warehouse is held in a relational structure. Aggregations are performed on the fly either by the database or in the analysis tool. • Multidimensional On-Line Analytical Processing (MOLAP): This information is aggregated in a predefined manner based on the characteristics of the Measures and the defined hierarchy of the Dimensions. Since the data is pre-aggregated, navigating through the hierarchies is instantaneous. The user is simply navigating to a point within the Multidimensional Cube and not performing any on the fly aggregations.
Storage Methodology Hybrid On-Line Analytical Processing (HOLAP): This is a combination of MOLAP and ROLAP. A portion of the data is predefined and aggregated. This would typically be the set of information that is accessed most frequently. Additional detail can be held in a ROLAP structure and allow a user to drill through the MOLAP structure into the ROLAP structure.
Client perspective MOLAP HOLAP ROLAP Query performance Fastest Faster Fast Storage consumption High Medium Low Storage Methodology Selection Criteria