
Pediatric Patient Data Analysis for Florida Hospitals
E N D
Presentation Transcript
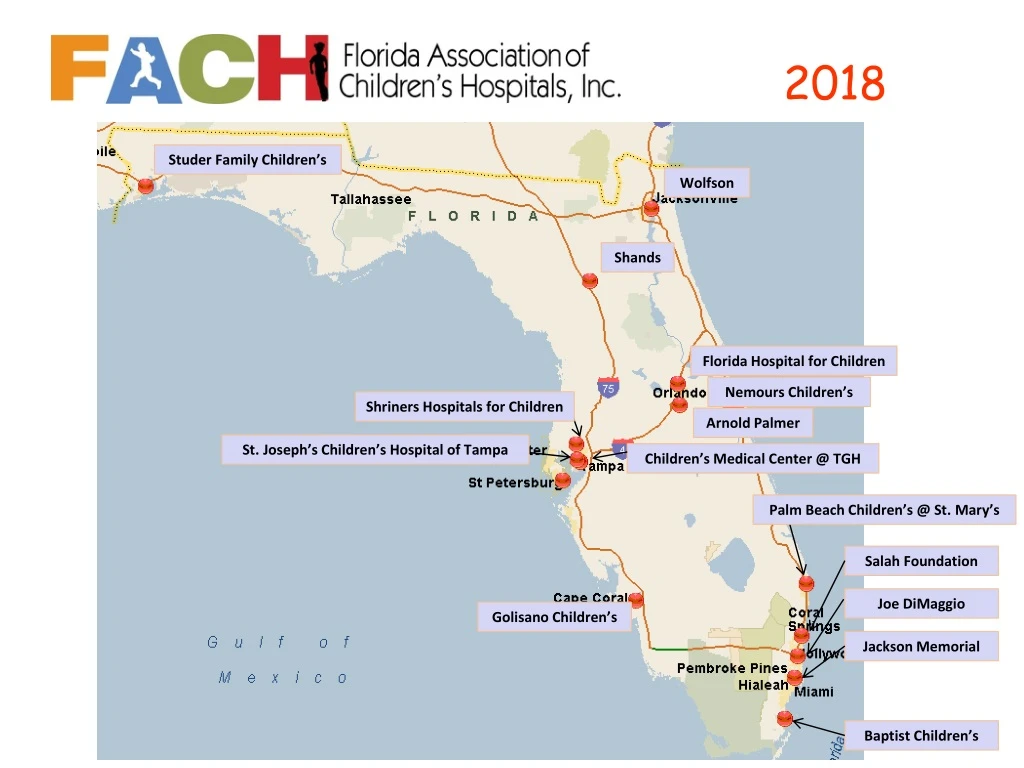
2018 Studer Family Children’s Wolfson Shands Florida Hospital for Children Nemours Children’s Shriners Hospitals for Children Arnold Palmer St. Joseph’s Children’s Hospital of Tampa Children’s Medical Center @ TGH Palm Beach Children’s @ St. Mary’s Salah Foundation Joe DiMaggio Golisano Children’s Jackson Memorial Baptist Children’s
Pediatric (Age 0-17) Discharges & Patient Days Excludes Normal Newborns, Obstetrics, Psychiatry & Rehabilitation Period of 07/01/2017-06/30/2018 Source: Truven/AHCA State Database
Pediatric Patient Day Volume* & Percent of Florida Pediatric Patient Days Period of 07/01/2017-06/30/2018 FACH Patient Days = 506,125 Total Patient Days = 861,918 *All medical/surgical pediatric (Age 0-17) and neonatal patients Excluding Normal Newborns, Obstetrics, Psychiatry & Rehabilitation Source: Truven/AHCA State Database
Pediatric Patient Day Volume* & Percent of Florida Pediatric Patient Days Period of 07/01/2017-06/30/2018 FACH Total Patient Days = 506,125 % of Total Patient Days = 58.7% *All medical/surgical pediatric (Age 0-17) and neonatal patients Excluding Normal Newborns, Obstetrics, Psychiatry & Rehabilitation Source: Truven/AHCA State Database
Pediatric Discharge Volume* & Percent of Florida Pediatric Discharges Period of 07/01/2017-06/30/2018 FACH Total Discharges = 67,219 Total Discharges = 124,644 *All medical/surgical pediatric (Age 0-17) and neonatal patients Excluding Normal Newborns, Obstetrics, Psychiatry & Rehabilitation Source: Truven/AHCA State Database
Pediatric Discharge Volume* & Percent of Florida Pediatric Discharges Period of 07/01/2017-06/30/2018 FACH Total Discharges = 67,219 % of Total Discharges = 53.9% *All medical/surgical pediatric (Age 0-17) and neonatal patients Excluding Normal Newborns, Obstetrics, Psychiatry & Rehabilitation Source: Truven/AHCA State Database
Pediatric Medicaid Patient Day Volume* & Percent of Florida Medicaid Pediatric Patient Days Period of 07/01/2017-06/30/2018 FACH Total Patient Days = 328,972 Total Patient Days = 563,079 *All medical/surgical pediatric (Age 0-17) and neonatal patients Excluding Normal Newborns, Obstetrics, Psychiatry & Rehabilitation Source: Truven/AHCA State Database
Pediatric Medicaid Patient Day Volume* & Percent of Florida Medicaid Pediatric Patient Days Period of 07/01/2017-06/30/2018 FACH Total Patient Days = 328,972 % of Total Patient Days = 58.4% *All medical/surgical pediatric (Age 0-17) and neonatal patients Excluding Normal Newborns, Obstetrics, Psychiatry & Rehabilitation Source: Truven/AHCA State Database
Pediatric Medicaid Discharge Volume* & Percent of Florida Medicaid Pediatric Discharges Period of 07/01/2017-06/30/2018 FACH Total Discharges = 39,416 Total Discharges = 75,463 *All medical/surgical pediatric (Age 0-17) and neonatal patients Excluding Normal Newborns, Obstetrics, Psychiatry & Rehabilitation Source: Truven/AHCA State Database
Pediatric Medicaid Discharge Volume* & Percent of Florida Medicaid Pediatric Discharges Period of 07/01/2017-06/30/2018 FACH Total Discharges = 39,416 % of Total Discharges = 52.2% *All medical/surgical pediatric (Age 0-17) and neonatal patients Excluding Normal Newborns, Obstetrics, Psychiatry & Rehabilitation Source: Truven/AHCA State Database
FACH Total Volume Medical = 56,050 (83.4%) Surgical = 11,169 (16.6%) Pediatric Volume* Medical vs Surgical Period of 07/01/2017-06/30/2018 *All medical/surgical pediatric (Age 0-17) and neonatal patients Excluding Normal Newborns, Obstetrics, Psychiatry & Rehabilitation Source: Truven/AHCA State Database
Pediatric ED Volume* & Percent of Florida Pediatric ED Volume Period of 07/01/2017-06/30/2018 FACH Total ED Volume = 482,410 Total ED Volume = 1,887,002 *All medical/surgical pediatric (Age 0-17) Includes Inpatient and Outpatient Volume Source: Truven/AHCA State Database
Pediatric ED Volume* Period of 07/01/2017-06/30/2018 FACH Total ED Volume = 482,410 % of Total ED Volume = 25.6% *All medical/surgical pediatric (Age 0-17) Includes Inpatient and Outpatient Volume Source: Truven/AHCA State Database
Pediatric ED Volume* As a Percent of Total ED Volume Period of 07/01/2017-06/30/2018 *All medical/surgical pediatric (Age 0-17) Includes Inpatient and Outpatient Volume Source: Truven/AHCA State Database
Pediatric Medicaid ED Volume* & Percent of Florida Pediatric Medicaid ED Volume Period of 07/01/2017-06/30/2018 FACH Total ED Volume = 330,135 Total ED Volume = 1,320,057 *All medical/surgical pediatric (Age 0-17) Includes Inpatient and Outpatient Volume Source: Truven/AHCA State Database
Pediatric Medicaid ED Volume* Period of 07/01/2017-06/30/2018 FACH Total ED Volume = 330,135 % of Total ED Volume = 25.0% *All medical/surgical pediatric (Age 0-17) Includes Inpatient and Outpatient Volume Source: Truven/AHCA State Database
Pediatric Medicaid ED Volume* As a Percent of Total Medicaid ED Volume Period of 07/01/2017-06/30/2018 *All medical/surgical pediatric (Age 0-17) Includes Inpatient and Outpatient Volume Source: Truven/AHCA State Database