Download
1 / 23
230 likes | 377 Views
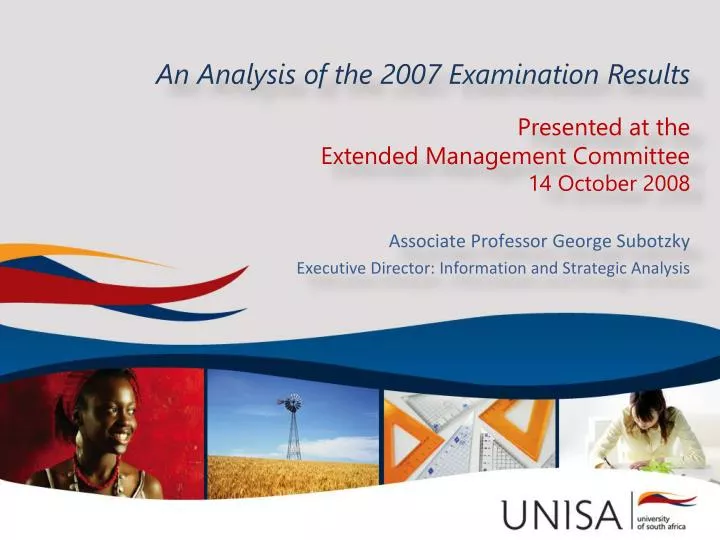
An Analysis of the 2007 Examination Results Presented at the Extended Management Committee 14 October 2008. Associate Professor George Subotzky Executive Director: Information and Strategic Analysis. Overview. This presentation focuses on the final 2007 examination results

E N D
An Analysis of the 2007 Examination ResultsPresented at the Extended Management Committee14 October 2008 Associate Professor George Subotzky Executive Director: Information and Strategic Analysis
Overview • This presentation focuses on the final 2007 examination results • It updates the preliminary analyses presented to the EMC in February and subsequently to Council, the Audit Committee and Senex • New elements in the 2007 analysis: • Exam results analysed in a way that is more consistent with HEMIS (to avoid multiple versions) • Nonetheless, for the purposes of disaggregation, these figures based on course counts, whereas HEMIS success rate is based on FTEs, which are always slightly lower (both figures are on the Portal) • Exam results analysed according to a more sophisticated and comprehensive exam modelling process and metrics – to highlight multiple points of risk • Analysis of exam success placed in relation to the larger success & throughput framework & initiative. The purpose of this is not only to describe trends, but to understand and explain them and ultimately to use actionable analytic/business intelligence to identify interventions to effect meaningful change and improve practice
Acknowledgements The following staff members of DISA provided invaluable help and support in preparing the examination results information and this presentation: Esmé Wiid Herbert Zemann Herman Visser Suzette van Zyl
Modelling and Improving Success & Throughput • CONCEPTUAL MODELLING: • Explaining success and throughput by systematically identifying all factors and their interrelationships • MEASUREMENT: • Profiling/tracking by means of available/obtainable data & information • STATISTICAL MODELLING: • Reliably establishing cause & effect • Identifying & predicting risk • Confirming/refining conceptual model • IMPROVING THROUGHPUT & SUCCESS: • Identification & implementation of interventions • Monitoring & evaluation of impact • Further improvements
Entry: Choice/ Inquiry/ Enrolment Learning activities/ interactions Success PersistenceRetention Through-put/ Graduation Employ-ment/ Citizenship • 1. Socio-Economic Circumstances: • Background/ Schooling • Current • 2. Individual • Factors/Attributes: • Ability • Skills • Attitudes & Interests • 3. Institutional • Factors: • Quality • Relevance • Effectiveness TRACKING: Individual-level progress through HE process aggregated by profile elements PROFILING/MODELLING/PREDICTION: - Snapshot/trends - Views: Course/Qualification; Dept/School/College/Institution
ROAP: • Pre-registration engagement: academic & socio-economic readiness, qualification and course choice & load Towards a model Individual Attributes • INDIVIDUAL FACTORS • Epistemological & Ontological Development • Goal Commitment • Institutional Commitment • PERSISTENCE • Academic integration • Social integration • Functional integration • Bridging interactions across distances (ODL) • Profiling, tracking & predicting individual, academic & socio-economic risk • PREPAREDNESS • Academic • Socio-Economic • INSTITUTIONAL FACTORS • Learner Support • Academic & Operational Systems SUCCESS THROUGHPUT & GRADUATE-NESS • BACKGROUND • Socio-Economic • Schooling • Culture • SOCIO-ECONOMIC FACTORS • Conducive Conditions & Support: Finance, time, health & wellness • Desired outcomes: • Quality, relevance, service excellence, efficiency, effectiveness Acknowledgements to Professor Chris Swanepoel, Dr Paul Prinsloo (members of modelling task team) and Dr At van Schoor
Key premises • Indications from considerable number of research findings, as well as throughput cohort studies: non-academic factors play a significant role in impeding success & throughput – ontological/sociological construct at the heart of the throughput model • Graduateness: ontological versus epistemological foundation: not so much what to students need to know, but who do they need to be in order to be effective in society as critical citizens and the market place as flexible innovators
Exam Process Model Gross Enrolments Canc. + Non-Active Nett Enrolments Exam Results Metrics Not Admitted Key Counts Exam Admission Qualified Readmission Re-registration (Repeaters) 3 Key Indicators Absent Admitted Drop Out/ Stop Out Stuck Writing Exam Pass Rate = Passed/Wrote Fail Write Not Admitted Results Sup. Admission Course Success Rate = Passed/Nett Enrolments Pass Absent Admitted Sup. Writing Fail Write Course Attrition Rate = (CA + NA + Abs)/ Gross Enrolments Sup. Results Success Pass 7 Risk Areas
100% Gross enrolments 92,4% 7,6% Active Non Active 98,6% 1,4% Admitted to Exam Active Cancel & Not Admitted 79,5% 20,5% Absent & Voluntary Cancel Wrote Exam 65,4% 0,2% 34,4% Passed (Exam Pass Rate) Results Outstanding Failed 49,0% 51,0% Qualified for Suppl Exam Did not Qualify 67,9% 32,1% Wrote Suppl Exam Absent & Cancel 49,8% 50,2% Passed Suppl Failed 55,8% 44,2% Course Success Rate (Combined Pass/Active) Course Attrition Rate (Nett)