Distribution of Medicaid Home and Community-Based Services Expenditures in FY 2011
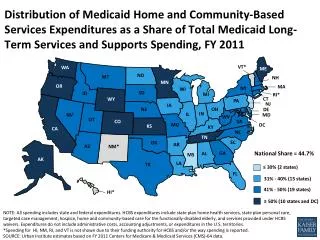
This report analyzes the distribution of Medicaid expenditures on Home and Community-Based Services (HCBS) as a percentage of total Medicaid long-term services and supports spending for Fiscal Year 2011. It highlights expenditures across various states, showing national averages and state-specific data. The findings reveal disparities, with some states devoting over 50% of their Medicaid budget to HCBS, while others allocate less than 30%. Notable exclusions and methodology are discussed, focusing on spending trends and service categories under these expenditures.

Distribution of Medicaid Home and Community-Based Services Expenditures in FY 2011
E N D
Presentation Transcript
Distribution of Medicaid Home and Community-Based Services Expenditures as a Share of Total Medicaid Long-Term Services and Supports Spending, FY 2011 ME VT* WA NH ND MT MN OR MA NY WI SD ID MI RI* CT WY PA NJ IA OH NE DE IN IL NV MD CO WV UT VA CA DC MO KS KY NC TN SC OK AZ AR NM* GA AL AK MS National Share = 44.7% LA TX ≤ 30% (2 states) FL 31% - 40% (15 states) HI* 41% - 50% (19 states) ≥ 50% (10 states and DC) NOTE: All spending includes state and federal expenditures. HCBS expenditures include state plan home health services, state plan personal care, targeted case management, hospice, home and community-based care for the functionally-disabled elderly, and services provided under HCBS waivers. Expenditures do not include administrative costs, accounting adjustments, or expenditures in the U.S. territories.*Spending for HI, NM, RI, and VT is not shown due to their funding authority for HCBS and/or the way spending is reported. SOURCE: Urban Institute estimates based on FY 2011 Centers for Medicare & Medicaid Services (CMS)-64 data.