Download
1 / 44
440 likes | 580 Views
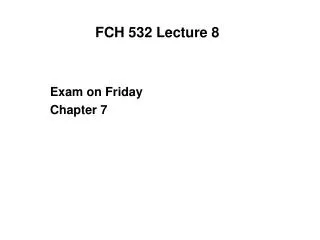
FCH 532 Lecture 16. Chapter 31. Pili/Fimbriae. Exclusively in Gram - bacteria Short, fine, hair-like appendages (hollow core) Composed of helical protein subunits Functions Not involved in motility.

E N D
FCH 532 Lecture 16 Chapter 31
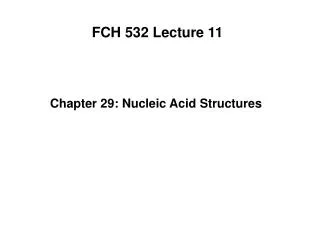
Pili/Fimbriae • Exclusively in Gram - bacteria • Short, fine, hair-like appendages (hollow core) • Composed of helical protein subunits • Functions • Not involved in motility. • Important for attachment of some bacterial species, e.g. Neisseria gonorrhoeae => pathogenesis • Sex Pilus: conjugation - transfer of genetic material between bacterial cells using the F-plasmid
Figure 31-3 Bacterial conjugation. Page 1218
Bacteria can transmit genes via conjugation • Bacterial conjugation is a process through which bacteria transfer genetic material. • Ability is conferred by a plasmid (F factor) for fertility factor. • Designated F+, has many hairlike projections called F-pilli that bind to cell-surface receptors on bacteria that lack the F factor (F- cells). • The F factor passes through a cytoplasmic bridge into the F- cell.
Figure 31-4 Diagram showing how an F– cell acquires an F factor from an F+ cell. Page 1218
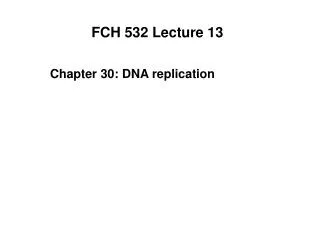
Figure 31-5 Transfer of the bacterial chromosome from an Hfr cell to an F– cell and its subsequent recombination with the F– chromosome. Sometimes the F factor will spontaneously integrate into the chromosome of an F+ cell. Hfr (high frequency of recombination) cells. F factor behaves like in the plasmid state. Part of the bacterial chromosome is transferred over in a fixed order. Page 1219
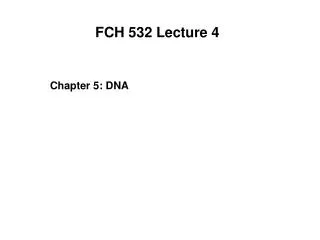
Figure 31-11aX-Ray structure of Taq RNAP core enzyme. a subunits are yellow and green, b subunit is cyan, b¢ subunit is pink, w subunit is gray. Page 1224
Figure 31-11b X-Ray structure of Taq RNAP. (b) The holoenzyme viewed as in Part a. Page 1224
Figure 31-12a The sequence of a fork-junction promoter DNA fragment. Numbers are relative to the transcription start site, +1. Page 1225
Figure 31-12b X-Ray structure of Taq holoenzyme in complex with a fork-junction promoter DNA fragment. Page 1225
Figure 31-13aModel of the closed (RPc) complex of Taq RNAP with promoter-containing DNA extending between positions –60 and +25. Page 1225
Figure 31-13bModel of the open (Rpo) complex of Taq RNAP with promoter-containing DNA showing the transcription bubble and the active site. Page 1225
RNA polymerase • RNAP holoenzyme (459 kD) ’. • Crystal structure for Taq RNAP solved by Seth Darst. • Active site has a Mg2+ ion. • DNA template lies across one face of the enzyme outside the active site. • Open and closed complexes. • Closed complex has UP element contacts. • Open complex, template strand of transcription bubble is in a tunnel formed by the ’subunits lined with basic amino acids. • This tunnel leads to the active site.
Rifamycins inhibit prokaryotic RNAP • Two related antibiotics: rifamycin B and rifampicin • 2 X 10⁻⁸ M rifampicin inhibits 50% RNAP • Binds to the subunit and prevents chain elongation.
Figure 31-14 The two possible modes of RNA chain growth. Growth may occur (a) by the addition of nucleotides to the 3¢ end and (b) by the addition of nucleotides to the 5¢ end. Page 1226
Chain elongation proceeds in the 5’ 3’ direction with RNAP • Experimentally proven with radiactively labelled [32-P]GTP. • For 5’ 3’ elongation, the 5’ -P is permanently labeled so that the chain’s level of radioactivity does not change upon replacement of labeled GTP with unlabeled GTP. • For 3’ 5’ elongation, the 5’ -P would be added with each nucleotide, so that on replacement of labeled GTP by unlabeled GTP, the RNA chains lose their radioactivity. • The 5’ 3’ elongation is observed experimentally, therefore, chain elongation proceeds 5’ 3’.
Figure 31-15 RNA chain elongation by RNA polymerase. Page 1227
Figure 31-16 An electron micrograph of three contiguous ribosomal genes from oocytes of the salamander Pleurodeles waltl undergoing transcription. Page 1228
RNA polymerase cannot proofread • Cannot rebind polynucleotide it has released. • Enzyme is processive. • No exonuclease activity. • Error rate is one wrong base for every ~104 transcribed. • DNA Pol I is one nt incorrect for every 107 • RNAP error rate is tolerable because most genes are repeatedly transcribed. • The genetic code has synonyms (redundancy). • Amino acid substitutions can be functionally innocuous. • Large portions of many eukaryotic transcripts are excised when forming mature mRNAs.
Chain termination • Transcriptional terminators share two common features: • A series of 4 - 10 consecutive A-Ts with the A’s on the template strand. The transcribed RNA is terminated in or just past this sequence. • A G-C rich region with a palindromic (2-fold) symmetric sequence that is immediately upstream of the series of A-Ts. This sequence forms a self-complementary “hairpin” that is very stable.
Figure 31-18 A hypothetical strong (efficient) E. coli terminator. Page 1229
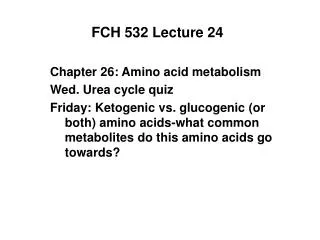
Rho factor aids in termination • Rho factor is ahelicase that unwinds RNA-DNA and RNA-RNA double helices dependent on the hydrolysis of NTPs. • Require a specific recognition sequence (80 -100 nt that lack a stable secondary structure and have multiple C rich regions, G poor regions) on the newly transcribed RNA upstream of the termination site. • Attaches to nascent RNA at recognition site and migrates in the 5’ 3’ direction until it encounters RNAP paused at termination site and unwinds the RNA-DNA duplex that forms the transcription bubble. • This releases the RNA transcript.
Figure 31-19a X-Ray structure of Rho factor in complex with RNA. (a) The Rho protomer with its N-terminal domain cyan, its C-terminal domain red, and their connecting linker yellow. Figure 31-19b X-Ray structure of Rho factor in complex with RNA. (b) The Rho hexamer. Its six subunits, each of which are drawn in a different color, form an open lock washer-shaped hexagonal ring. Page 1231
Figure 31-19c X-Ray structure of Rho factor in complex with RNA. (c) The solvent-accessible surface of the Rho hexamer as viewed from the top of Part b. Page 1231
Control of transcription in prokaryotes • Prokaryotes need to respond to sudden environmental changes such as the influx of nutrients, by inducing the synthesis of proteins. • Transcription and translation are tightly coupled. • Ribosomes commence translation near the 5’ end of the nascent mRNA soon after it is made by RNAP. • Most prokaryotic transcripts are degraded within 1 - 3 min after their synthesis. • In contrast, eukaryotic induction takes hours or days to respond because the transcription takes place in the nucleus and has to be exported to the cytoplasm for translation.
Figure 31-24 An electron micrograph and its interpretive drawing showing the simultaneous transcription and translation of an E. coli gene. Page 1237
Promoters • The more the promoter resembles the consensus sequence, the stronger the promoter.
lac repressor binding • lac repressor is a tetramer of 360 residue subunits which are each capable of binding one IPTG with a K = 10-6 M. • In the absence of inducer, binds to duplex DNA nonspecifically (K = 10-4) • Binds to the lac operator tightly (K = 10-13 M). • Binds faster than diffusion rate constant in solution, so lac repressor slides along DNA quickly until it finds the lac operator sequence. • lac operator sequence is nearly palindromic. • lac repressor prevents RNAP from forming a productive initiation complex.
Figure 31-25 The base sequence of the lac operator. Page 1239
Figure 31-26 The nucleotide sequence of the E. coli lac promoter–operator region. N-terminus LacZ C-terminus LacI Page 1239
Catabolite repression • Glucose is the carbon source of choice for E. coli, so if it is present in large amounts, the bacterium will suppress the expression of genes encoding proteins involved in other catabolites’ metabolism. • This happens even when metabolites such as lactose, arabinose, or galactose are present in high concentrations. • Catabolite repression-prevents the wasteful duplication of energy-producing enzymes.
Figure 31-27 The kinetics of lac operon mRNA synthesis following its induction with IPTG, and of its degradation after glucose addition. Page 1240
cAMP is the signal molecule for lack of glucose • cAMP is the signal molecule indicating a lack of glucose. • In the presence of glucose, cAMP levels are diminished. • Addition of cAMP overcomes catabolite repression by glucose. • cAMP binding protein responsible for the action-catabolite activator protein (CAP); cAMP receptor protein (CRP). • CAP is a homodimer of 210 residue subunits that undergoes large conformational change upon binding to cAMP. • CAP-cAMP complex binds to the lac operon and stimulates transcription in the absence of lac repressor.
CAP-cAMP promotes high levels of expression for a weak promoter • CAP-cAMP complex binds to the lac operon and stimulates transcription. • CAP is a positive regulator-turns on transcription • lac repressor is a negative regulator - turns off transcription • lac operon has a weak (low-efficiency) promoter because it differs significantly from the consensus sequence. • CAP interacts directly with RNAP via the C-terminal domain (CTD). • CTD binds to dsDNA nonspecifically but with higher affinity to A-T rich sites (UP elements).
Figure 31-28a X-Ray structures of CAP–cAMP complexes. (a) CAP–cAMP in complex with a palindromic 30-bp duplex DNA. Page 1241
Figure 31-28b X-Ray structures of CAP–cAMP complexes. (b) CAP–cAMP in complex with a 44-bp palindromic DNA and the aCTD oriented similarly to Part a. Page 1241
Figure 31-28cX-Ray structures of CAP-cAMP complexes. (c) CAP dimer’s two helix-turn-helix motifs bind in successive major grooves of the DNA. Page 1241
CAP-dependent promoters • Class I promoters (lac operon) require only CAP-cAMP for transcriptional activation. CAP binding site can be located at various distances on the DNA. • Class II promoters also only require CAP-cAMP for transcriptional activation. CAP binding site only occupies a fixed position that overlaps the RNAP binding site. • Class III promoters require multiple activators to maximally stimulate transcription. May be more than one CAP-cAMP complexes or a CAP-cAMP complex in concert with promoter specific activators.
DNA binding motifs • CAP proteins form a supersecondary structure called a helix-turn-helix (HTH) motif that binds to DNA. • HTF motifs associate with target base pairs mainly via side chains extending from the second helix of the HTH motif (recognition helix). • HTH motifs are observed in the lac repressor, trp repressor, cI repressors, and Cro proteins from bacteriophages. • Another type of structural motif observed in DNA binding proteins are -ribbons or two stranded anti-parallel b-sheets. • -ribbons are found in the met repressor (MetJ).
Figure 31-29 X-Ray structure of the N-terminal domain of 434 phage repressor-target DNA complex. (a) A skeletal model (b) HTH (a2, a3) interaction with target DNA (c) A space-filling model. Page 1243
Figure 31-30X-Ray structure of the 434 Cro protein in complex with DNA. (a) A skeletal model. (b) HTH (a2, a3) interaction with target DNA (c) A space-filling model. Page 1243
Figure 31-31 X-Ray structure of an E. coli trp repressor– operator complex. Page 1244
Figure 31-32a X-Ray structure of the E. coli met repressor- SAM-operator complex. (a) The overall structure of the complex as viewed along its 2-fold axis of symmetry. Page 1245
Figure 31-32bX-Ray structure of the E. coli met repressor-SAM-operator complex. (b) The antiparallel b ribbon (yellow) in the DNA’s major groove. Page 1245