Download
1 / 33
330 likes | 533 Views
The General Linear Model. A Basic Introduction Roger Tait (rt337@cam.ac.uk). Overview. What is imaging data How is data pre-processed Hypothesis testing GLM: simple linear regression Analysis software How to process results. What is imaging data?. Data. A stack of numbers.

E N D
The General Linear Model A Basic Introduction Roger Tait (rt337@cam.ac.uk)
Overview • What is imaging data • How is data pre-processed • Hypothesis testing • GLM: simple linear regression • Analysis software • How to process results
Data A stack of numbers Structural fMRI Functional
Reorientation Native Reoriented MNI152
Basic pre-processing (fmri) worest.nii obrain.nii omprage.nii omrest.nii wnomrest.nii nomrest.nii
Basic pre-processing (structural) wgmomprage.nii gmomprage.nii omprage.nii
5% Parametric Null Distribution Hypothesis testing Statistical inference is commonly done with a test statistic (t, F, c2…) which has a distribution under H0 mathematically derived. For example ^ ^ b1 – b0 t = ^ ^ SE(b1 – b0) t NB: this assumes that the errors are independent and normally distributed.
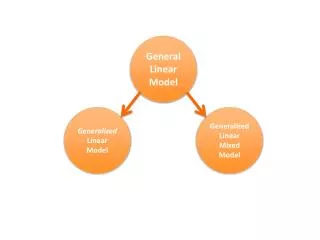
Introducing The GLM Y = Xb + e • Encapsulates: t-test (paired, un-paired), F-test, ANOVA (one-way, two-way, main effects, factorial) MANOVA, ANCOVA, MANCOVA, simple regression, linear regression, multiple regression, multivariate regression…… DATA = MODEL + ERROR DATA = KNOWN * UNKNOWN + ERROR
GLM definition Y = Xb + e • Where Y is a matrix with a series of observed measurements • Where X is a matrix that might be a design matrix • Where b is a matrix containing parameters to be estimated • And e is a matrix containing error or noise
GLM: Simple Linear Regression Y = b0 + X1b1 + e b0: is the Y axis intercept Y b1: is the gradient of slope Y: the black circles e: diff between predicted Y and observed Y X
GLM: Simple Linear Regression ^ Y = b0 + X1b1 + e ^ • This is done by choosing b0 and b1 so that the sum of the squares of the estimated errors S ei2 is as small as possible. • This is called the Method of Least Squares. • S ei2 is called the Residual Sum of Squares (RSS)
GLM example DATA = KNOWN * UNKNOWN + ERROR = mean reaction time + GENDER + AGE Y = b0 + X1b1+ X2b2+ X3b3+ X4b4+ e
Dummy Variables • Continuous variables • measurements on a continuous scale (age, mRT) (-4.01, -0.47, 6.35, -7.06, -7.69, -14.24) • Dummy Variables • Code for group membership (disease, gender) controls = 0, patients = 1 females = 1, males = -1
Usage • Hypothesis tests with GLM can be multivariate or several independent univariate tests • In multivariate tests the columns of Y are tested together • In univariate tests the columns of Y are tested independently (multiple univariate tests with the same design matrix)
fMRI model specification silent naming task The model BOLD signal
Structural analysis with CamBA sex weight group
Where are my clusters? here is a big cluster here is a big cluster
Where is the cluster I am interested in? position mouse cursor here cluster location information shown here
Statistical Testing • Convert cluster into a binary mask • Overlay mask on subject data • Extract voxel intensities • Do some statistical analysis to get more information from your data
Correlation with behaviour for cluster Pos_002 p>0.05 close but cluster Pos_001 does not significantly correlate with behaviour HIT1
Other Analyses different from 0 one-sample t-test Difference between means two-sample t-test Linear relationship between 2 variables simple regression
Other types of analyses • Factorial designs • Permits analysis of multiple time data • Shows • Main effects of Factor 1 (time) • Main effects of Factor 2 (group) • Interaction between Factor 1 and Factor 2
Useful software package • CamBA – Cambridge • http://www-bmu.psychiatry.cam.ac.uk/software/ • FSL Randomise – Oxford • http://fsl.fmrib.ox.ac.uk/fsl/fslwiki/Randomise • SPM8 – UCL • http://www.fil.ion.ucl.ac.uk/spm/software/spm8/
In summary • The GLM allows us to summarize a wide variety of research outcomes by specifying the exact equation that best summarizes the data for a study. If the model is wrongly specified, the estimates of the coefficients (the beta values) are likely to be biased (i.e. wrong) and the resulting equation will not describe the data accurately. • In complex situations (e.g. cognitive fMRI paradigms), this model specification problem can be a serious and difficult one