1 / 0

Research Methods for the CREW Diagnostic Country Reports, August 9, 2013 Zambia

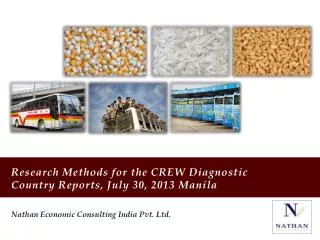
Research Methods for the CREW Diagnostic Country Reports, August 9, 2013 Zambia. Nathan Economic Consulting India Pvt. Ltd. . Introduction.

adora
Download Presentation

Research Methods for the CREW Diagnostic Country Reports, August 9, 2013 Zambia

An Image/Link below is provided (as is) to download presentation Download Policy: Content on the Website is provided to you AS IS for your information and personal use and may not be sold / licensed / shared on other websites without getting consent from its author. Content is provided to you AS IS for your information and personal use only. Download presentation by click this link. While downloading, if for some reason you are not able to download a presentation, the publisher may have deleted the file from their server. During download, if you can't get a presentation, the file might be deleted by the publisher.

E N D

Presentation Transcript


  1. Research Methods for the CREW Diagnostic Country Reports, August 9, 2013 Zambia

    Nathan Economic Consulting India Pvt. Ltd.
  2. Introduction This study aims to assess the state of competition and benefits of competition reforms on consumers and producers in selected product markets and countries, especially focusing on the impact that past and existing public policies, regulations, private sector business practices, institutional arrangements and other factors have had on consumer and producer welfare*. The goal of the project is to better demonstrate measurable benefits from effective competition reforms in DCs, for ensuring long-term support for competition. *Due to discussions and concerns about the term “producer welfare” we recommend using the term producer benefits.
  3. Introduction: Three Phases The first phase of this project is the Diagnostic phase, which started with the selection of four countries and two sectors for the study: The next stage in the Diagnostic phase is to identify a standardized framework in which the analysis is to be conducted through Diagnostic Country Reports (DCRs). In the Design phase, developing the toolkit to do the impact analysis. The impact analysis will be done and quantified in the Validation phase.
  4. We are currently still in the Diagnostic Phase
  5. Conceptual Framework for Phase I
  6. Objectives of the DCR At the first level it will provide a detailed background on the market structure of the 2 sectors in the 4 countries, including the regulatory structure, using the DFID Competition Assessment Framework to answer questions about the competitive landscape of the market. Next, the DCR will provide a criteria for identifying the competition-enhancing reforms that have already taken place, or could take place, which would promote competition. Third, after identifying the reforms, the DCR will provide the analysis framework to: define the relevant market, identify players and stakeholders who will/could be affected including both consumers and producers, frame the hypotheses for testing and define the counterfactual,. identifying the data required, data sources, and methods to test the hypotheses. It is important to remember that the DCR just provides a framework and the actual analysis comes later.
  7. Step 1-Competition Analysis The DFID Competition Assessment Framework will be the basis for assessing the competitive landscape in the chosen sectors in each of the four countries. Identifying the markets and competitors Examining the market structure Looking for barriers to entry (or exit) Looking for anti-competitive conduct Considering vested interests and the principal beneficiaries Identifying government policies or institutions that limit competition Use “Porter’s Five Forces of Competition” to recommend industries’ strengths and weaknesses: 1. Nature of competition in the industry 2. Potential of new entrants into industry 3. Power of suppliers 4. Power of customers 5. Threat of substitute products
  8. Step 2-Identifying Competition Enhancing Reforms Identify elements of competition reforms to be examined in each sector starting with identifying reforms which are targeted or likely to have an impact on competition. “Reforms” include: Enabling government policies that promote competition in markets. Appropriate regulatory framework and institutions for promoting competition in sectors including sector-specific regulations Effective competition enforcement institutions The criteria for selecting the reforms/recommended reforms will be based on the OECD’s Competition Assessment Toolkit looking at whether the reforms/recommended reforms: Remove barriers to entry and increase number and range of suppliers Allow suppliers to compete Incentivize suppliers to compete Increase investment Ex-post vs Ex-ante analysis
  9. Step 3 – Impact Analysis Framework Defining the relevant market The relevant market has to be defined so that impact analysis can be focused. Definition of the relevant product market Definition of the relevant geographic market Will likely be a qualitative analysis Next, identify the stakeholders that could be affected: Consumers Focusing on only End Consumers Producers Incumbents New entrants
  10. Identification of Stakeholders – Staple Food A non-exhaustive list for discussion:
  11. Identification of Stakeholders – Bus Transport Map relevant stakeholders along the supply chain to clearly illustrate the particular stage of the pre-production, production, or distribution stages where the impact of a particular reform measure is likely to be felt.
  12. Determination of Hypotheses – Staple Food A pertinent hypothesis should ask to what extent a reform measure affected competition in the market, and how it affected consumers and producers. Some potential hypotheses: Staple Food
  13. Determination of Hypotheses – Bus Transport Bus Transport It is also important to define the Counterfactual –would the result have been the same regardless of the reform?
  14. Definition of Benefits to Consumer and Producers Impacts onconsumer welfare will focus on the end consumer On the producer side, the project will look at reforms throughout the various levels of the supply chains Impact on producers should be measured as benefits accruing to them from: Ease of entry, Ease of doing business, Operational efficiencies.
  15. Identification of Variables and Data to be Collected Potential variables capturing consumer welfare andbenefits to producers include:
  16. Identification of Variables and Data to be Collected Potential sector -wise data to collect from primary and secondary sources:
  17. Data Collection - Data Sources Data is available from a combination of Secondary sources (census, government records, international statistics) Primary sources (survey, focus groups) Secondary sources may include: Competition Authority, if existent Ministry of Commerce/Trade Government censuses Business Associations International donor agencies such as the World Bank Local research institutes Consumer Protection Agencies Publicly available online sources If no secondary data are available, turn to primary data collection, such as surveys or focus group discussions. Keep in mind the variables to be measured and budget/resource constraints
  18. Primary Data Collection: Sampling Methods and Strategies A single methodology should be employed across countries when possible Probability sampling: random selection of sample elements from sampling frame Simple Random Sampling Random Sampling Stratified Random Sampling Non-Probability sampling: should be used as a secondary option when probability sampling is not possible Accidental sampling (such as ‘man on the street’) Snowballing Purposive sampling A broad strategy including a stratified random sampling method, with clustering to control costs if the geographic areas are large, could be utilized in this study. Stratification divides elements into population subgroups, ensuring representation from each; strata here could be defined based on region and urban/rural Clustering lowers costs when populations are spread across large geographic areas For bus transport a non-probability sampling method might be most feasible Nationally representative sample vs. cost constraints
  19. Primary Data Collection: Sampling Size The sample size should be large enough for the analysis to be statistically significant while balancing survey and project costs. Formulas calculate the sample size (n) based on the following parameters: Population of the sampling frame (N) Degree of variance (P) Precision desired (α) Confidence interval (Z) Response rate (R) Below is an illustrative example:
  20. Primary Data Collection: Survey Design Primary data for the analysis will be collected through a survey. Questionnaires will be designed for both producers and consumers in each sector Slight modifications , including translation to local languages, will be made on a country-specific basis, but the questions in general should be similar across countries Survey canvassing via a combination of email, phone and in person interviews Data collection using either pen and paper interviewing (PAPI) or computer assisted personal interviewing (CAPI). CAPI via PDAs is recommended Surveyor training Piloting Follow-up and spot checks for quality control
  21. Types of Analysis Quantitative Analysis Time Series Variation Spatial Variation Analysis Difference-in-Difference Cost-Benefit Qualitative Analysis Focus Group Discussions In-depth Individual Interviews Case Studies Cross Country Analysis
  22. Quantitative Analysis Techniques Time Series Analysis compares data before and after a regulatory reform is introduced Data availability limitations Carefully choose data time periods Use econometric rigor to avoid estimation errors Spatial variation is a method that compares two sets of markets which are identical or similar in all respects, except for the regulatory constraint introduced. Produces more precise estimates of the effect of policy reform Very data intensive. Often difficult to find two sample sets that are characteristically similar, except for the regulatory reform being studied. Difference-in-Difference combines time series analysis with spatial variation to compare two different markets at two time periods, with a reform occurring in one Use multiple regression techniques to control for external factors
  23. Quantitative Analysis Techniques (cont’d)… Regression analysis: Methods include ordinary least squares (OLS), two-stage least squares (2SLS), and limited dependent variable techniques (logitorprobitmodels). Dependent variable such as price, rate of technical change Modeled as a function of exogenousindependent variables Dummy variable indicates the “regulated” period; the sign and coefficient of the dummy corresponds to the impact and size impact of the regulation. If data constraints don’t allow for regression analysis, other tests many be used: Parametric Tests Non-parametric tests
  24. Quantitative Analysis – Cost Benefit Analysis Measures the impact of an intervention in terms of the Economic benefits it generates or gains to the economy relative to Actual and opportunity costs of the intervention or losses to the economy Steps to undertake Quantify the impacts, positive and negative, tangible and intangible If the reform has not yet occurred, estimate the likely impact of the expected reform Calculate of social costs, both the tangible and the intangible. Determine which are attributable to the reform Convert all costs and benefits to USD Discount the future value of costs and benefits as they accrue over time Compare of the costs and benefits to determine the net social rate of return Use a qualitative approach whenever benefits would be intrinsic and not measurable in monetary terms such as improvements in quality, innovations, and new products.
  25. Qualitative Analysis Used in the absence of sufficient data to undertake a purely quantitative evaluation Poses open-ended questions about reform strengths and shortfalls to provide a source of new information on benefits or potential ideas for future reforms. Cover all levels of stakeholders Focus Group Discussions (FGD) and In-depth Individual Interviews Discussions with an individual or sample group in order to understand their in-depth experiences Provides insight explaining the results of the quantitative analysis Provide a basis for case studies Case study: an individual study highlighting the experience of an individual, group, or company to give context and a personal touch to the numbers
  26. Potential Issues Data unavailability Cost of collecting nationally representative data samples How to measure: Improvements in quality, innovations, and new products Tradeoffs between price and quality Tradeoffs between producer and consumer welfare Determining pass-on of benefits between various levels of consumers How to treat transfers of producer to consumer surplus and how to define net welfare Weighing short-run vs. long-long tradeoffs of welfare Controlling for external factors Attributing impact to a certain reform Access to consistent measures across countries
  27. Contact Us Nathan India Nathan Economic Consulting India Private Ltd. Chennai New Delhi No. 45, George Ponnaiya Building, Level 4, Rectangle 1, TTK Road, Alwarpet, Commercial Complex D-4, Saket, Chennai 600 018 New Delhi 110 017 T: +91 44 4293 7700 T: +91 11 4051 4076 F: +91 44 4293 7777 F: +91 11 4051 4052 Nathan Associates Inc. 2101 Wilson Boulevard Arlington, VA 22201 Washington DC Metro Area T: 703-516-7700 F: 703-351-6162 e-mail: nathanindia@nathaninc.com web: www.nathaninc.com Nathan India
More Related