Download
1 / 1
10 likes | 88 Views
0. . 6. 1. -. 0. . 7. 5. 0. . 7. 6. -. 0. . 9. 0. . 9. 1. -. 1. . 0. 5. 1. . 0. 6. -. 1. . 2. 1. . 2. 1. -. 1. . 3. 5. 5. 1. . 3. 6. -. 1. . Human Campylobacteriosis: Can Identified Risk Factors Explain Seasonality & Regional Variation?.

E N D
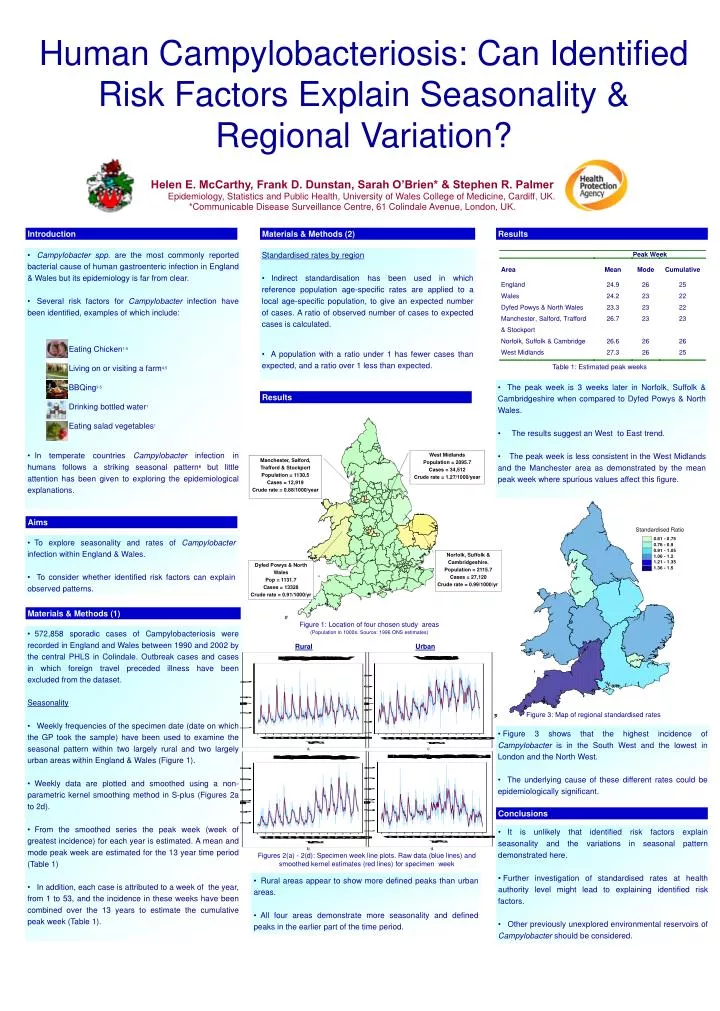
0 . 6 1 - 0 . 7 5 0 . 7 6 - 0 . 9 0 . 9 1 - 1 . 0 5 1 . 0 6 - 1 . 2 1 . 2 1 - 1 . 3 5 5 1 . 3 6 - 1 . Human Campylobacteriosis: Can Identified Risk Factors Explain Seasonality & Regional Variation? Helen E. McCarthy, Frank D. Dunstan, Sarah O’Brien* & Stephen R. Palmer Epidemiology, Statistics and Public Health, University of Wales College of Medicine, Cardiff, UK. *Communicable Disease Surveillance Centre, 61 Colindale Avenue, London, UK. Introduction Materials & Methods (2) Results • Campylobacter spp. are the most commonly reported bacterial cause of human gastroenteric infection in England & Wales but its epidemiology is far from clear. • Several risk factors for Campylobacter infection have been identified, examples of which include: • Eating Chicken1-5 • Living on or visiting a farm4,5 • BBQing3-5 • Drinking bottled water1 • Eating salad vegetables1 • In temperate countries Campylobacter infection in humans follows a striking seasonal pattern6 but little attention has been given to exploring the epidemiological explanations. • Standardised rates by region • Indirect standardisation has been used in which reference population age-specific rates are applied to a local age-specific population, to give an expected number of cases. A ratio of observed number of cases to expected cases is calculated. • A population with a ratio under 1 has fewer cases than expected, and a ratio over 1 less than expected. Table 1: Estimated peak weeks • The peak week is 3 weeks later in Norfolk, Suffolk & Cambridgeshire when compared to Dyfed Powys & North Wales. • The results suggest an West to East trend. • The peak week is less consistent in the West Midlands and the Manchester area as demonstrated by the mean peak week where spurious values affect this figure. Results West Midlands Population = 2095.7 Cases = 34,512 Crude rate = 1.27/1000/year Manchester, Salford, Trafford & Stockport Population = 1130.5 Cases = 12,919 Crude rate = 0.88/1000/year Aims Standardised Ratio • To explore seasonality and rates of Campylobacter infection within England & Wales. • To consider whether identified risk factors can explain observed patterns. Norfolk, Suffolk & Cambridgeshire. Population = 2115.7 Cases = 27,120 Crude rate = 0.99/1000/yr Dyfed Powys & North Wales Pop = 1131.7 Cases = 13328 Crude rate = 0.91/1000/yr Materials & Methods (1) Figure 1: Location of four chosen study areas (Population in 1000s. Source: 1996 ONS estimates) • 572,858 sporadic cases of Campylobacteriosis were recorded in England and Wales between 1990 and 2002 by the central PHLS in Colindale. Outbreak cases and cases in which foreign travel preceded illness have been excluded from the dataset. • Seasonality • Weekly frequencies of the specimen date (date on which the GP took the sample) have been used to examine the seasonal pattern within two largely rural and two largely urban areas within England & Wales (Figure 1). • Weekly data are plotted and smoothed using a non-parametric kernel smoothing method in S-plus (Figures 2a to 2d). • From the smoothed series the peak week (week of greatest incidence) for each year is estimated. A mean and mode peak week are estimated for the 13 year time period (Table 1) • In addition, each case is attributed to a week of the year, from 1 to 53, and the incidence in these weeks have been combined over the 13 years to estimate the cumulative peak week (Table 1). Rural Urban Figure 3: Map of regional standardised rates • Figure 3 shows that the highest incidence of Campylobacter is in the South West and the lowest in London and the North West. • The underlying cause of these different rates could be epidemiologically significant. a. c. Conclusions • It is unlikely that identified risk factors explain seasonality and the variations in seasonal pattern demonstrated here. • Further investigation of standardised rates at health authority level might lead to explaining identified risk factors. • Other previously unexplored environmental reservoirs of Campylobacter should be considered. b. d. Figures 2(a) - 2(d): Specimen week line plots. Raw data (blue lines) and smoothed kernel estimates (red lines) for specimen week • Rural areas appear to show more defined peaks than urban areas. • All four areas demonstrate more seasonality and defined peaks in the earlier part of the time period.