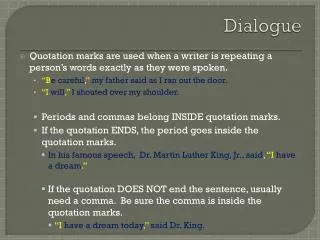
Data Dialogue
Data Dialogue. Theories of Causation. Data Analysis Protocol. Identify Strengths Weaknesses Trends Outliers Focus on 3 Strengths Weaknesses. Data Dialogue Summary # 1. "Why does the gap" is not an area of exploration but is an assumption. Area of Exploration

Data Dialogue
E N D
Presentation Transcript
Data Dialogue Theories of Causation
Data Analysis Protocol • Identify • Strengths • Weaknesses • Trends • Outliers • Focus on 3 • Strengths • Weaknesses
Data Dialogue Summary # 1 "Why does the gap" is not an area of exploration but is an assumption. Area of Exploration Why does the gap exist between curriculum and achievement? 3rd grade reading is in bottom 10% of MEAP. Inquiry Questions Is there a written curriculum that is aligned to the CCSS? Do teachers have access to this curriculum? Are teachers trained effectively? What is the district’s definition of curriculum? Data Sources to be Used for Data Dialogue Actual Curriculum Surveys Common Formative Assessments SEC MEAP Narrative Statements Derived from Phase 2 of the Data Dialogue From Fall 2009 to 2012, 3rd grade reading scores dropped 30% on the MEAP. Reading comprehension dropped from 40% to 20%. Causal Theories from Phase 3 of the Data Dialogue Instruction – 1st and 2nd grade did not focus on comprehension based on 3-year trend. Confirmation of Causal Theories SEC data Lesson Plans Grades Common Formative Assessments (DOK, Alignment to GLC and CCSS) Action Steps to Address Narrative Statements PLCs in all grade levels Identify standards taught to common assessment Align to CCSS, GLC, DOK (vertical and horizontal) Why is the inquiry into curriculum rather than instruction? If you list the sources, you should have a narrative statement for each source. What did you find by using that source? • Try to eliminate percentages and work with real numbers so you create more specific intentions. What did each of these actually confirm?
Data Dialogue Summary # 2 Does the “Area of Exploration” match the inquiry? Area of Exploration The skill deficit is reading. Inquiry Questions What is the skill deficiency for all grades in reading. Why is there a skill deficiency gap in 4th grade reading in comprehension between males and females? Data Sources to be Used for Data Dialogue 2012-2013 MEAP data in reading. 5 year trend data by grade and sub group SEC report Narrative Statements from Phase 2 of the Data Dialogue 4th grade girls scored 30% higher than boys on the MEAP reading strand in Fall 2012. From 2009 to 2012, girls scored an average of 35% higher than boys on MEAP comprehension. Causal Theories from Phase 3 of the Data Dialogue Curriculum and Instruction: A review of the SEC reports indicates that 3rd and 4th grade teachers spent more time teaching phonics than they did comprehension. Confirmation of Causal Theories Action Steps to Address Narrative Statements PD for teachers Are we looking at all grades or specific grades? What data is being used to confirm cause? What PD? How is this going to affect the cause?
How could these summaries of “imagined” data dialogues be strengthened? • Is the area of exploration worthy? • Are multiple data sources used? Are they the most significant to address the target area? • Is there alignment between the narrative statements and the causal theories? Have the causal theories been extensively explored and prioritized? • Is there sufficient confirmation of key causal theories? • Are the action steps sufficient to address the narrative statement(s)? • In what other ways would you like to see the results of these data dialogues strengthened?
Sample Question #1 • An example of a question based on only one measure is “How did my 4th grade students do on the MEAP math assessment this year?” The measure is MEAP Results, which are student outcome data. This would be an appropriate question to ask as soon as MEAP scores became available, so that the teacher could see how their students did on the MEAP based on the previous grade. The results could indicate where the teacher might need to provide some extra instruction, if there are standards from 3rd grade that students seemed to struggle with.
Sample Question #2 • A question that would be answered by an intersection of demographic data and student outcome data (MEAP scores by gender) is: What (if any) is the difference in MEAP scores between males and females? If there were a significant difference in scores, additional research should be done re: why there is a difference between the scores of males and females. Once the potential causes are determined, they can be addressed. If only the MEAP scores were reviewed, it could not be determined if there were any gender-specific issues that would need to be further researched and addressed.
Sample Question #3 • A question that would be answered by an intersection of demographic (ethnic subgroup), process (use of graphing calculators), and student outcome data (unit test results) is: Is the integration of graphing calculators into Algebra I helping to improve students’ conceptual understanding of systems of equations for all of the students or only certain ethnic subgroups? It would be difficult to evaluate the effectiveness of the graphing calculators without looking at some type of student outcome data. If you did not also look at the data across subgroups, you would not be able to see if there was a pattern as to who the graphing calculators may be more helpful in increasing conceptual understanding or if they seemed to be helping all students.
How do we select data for a data conversation? • Identify an issue that you are interested in collaboratively exploring further. (A curriculum gap, an instructional gap, student skill deficit, student behavioral pattern, etc.) • Develop question(s) to begin your inquiry process. • Determine at least three diverse data sources you might tap in order to explore your issue. Include both qualitative and quantitative data. (Use multiple measures of data!) • Decide how to best represent the data for group examination. Source: Got Data? Now What? Lipton & Wellman, 2012
What questions do you have? Tammy Hereau Data Analyst/School Improvement Facilitator 786-9300 ext. 115 280-5977 thereau@dsisd.k12.mi.us Lacy Lauzon Behavior Consultant/MTSS Coordinator 786-9300 ext. 208 llauzon@dsisd.k12.mi.us