Differentially Expressed Proteins in PBMCs Following In Vitro LPS Exposure for Sepsis Biomarker Research
This study investigates the cellular response of peripheral blood mononuclear cells (PBMCs) to bacterial lipopolysaccharides (LPS) from gram-negative bacteria, aiming to identify potential biomarkers for sepsis. Using blood from healthy donors, we applied LPS to stimulate PBMCs, followed by protein isolation and digestion. The peptides were analyzed using LC-MS/MS, revealing significant differences in protein expression related to immune response pathways. This methodology highlights the potential of PBMCs as an effective model for biomarker discovery in sepsis research.

Differentially Expressed Proteins in PBMCs Following In Vitro LPS Exposure for Sepsis Biomarker Research
E N D
Presentation Transcript
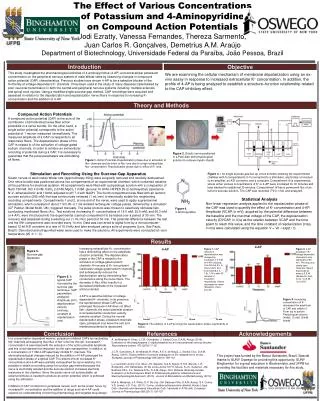
Detection of Cellular Response to an in vitro Challenge with Bacterial Gram-Negative Lipopolysaccharides (LPS) in Peripheral Blood Mononuclear Cells (PBMCs) for Biomarker Research David Sarracino1, Jennifer N Sutton1, Maryann S Vogelsang1, Bryan Krastins1, Gregory Byram1, Amol Prakash1, Vineet Gupta2, Mary F Lopez1 1Thermo Fisher Scientific, BRIMS (Biomarker Research Initiatives in Mass Spectrometry), Cambridge, MA; 2Rush University Medical Center, Chicago, Il Overview Purpose: To find differentially expressed marker proteins for sepsis in an in vitro model environment. Methods: Blood from healthy volunteers is treated with toxic ligands secreted by gram-negative bacteria. PBMCs are isolated, reduced, alkylated, digested with trypsin. The resulting peptides are analyzed using liquid chromatography-tandem mass spectrometry (LC-MS/MS). Differential peptides are identified by Thermo Scientific™ Proteome Discoverer™ software and compared using Thermo Scientific™ Pinpoint™ software. Results: Full scan quantification of several hundred relevant kinase and pathway specific proteins generated from over 4000 identified proteins. Introduction Gram-negative bacteria, and a major component, lipo-polysaccharides (LPS), are associated with sepsis. In this study, we look at global protein profiling of mononuclear cells from LPS-challenged whole blood. Mononuclear cells are easy to collect and have little of the protein dynamic range difficulties associated with plasma. In addition, they are responsive to many immune state conditions, making them ideal targets for biomarker discovery experiments. Using an in vitro stimulation using a whole blood system directly in tubes used for the isolation allows for a highly facile method for looking for changes in either secreted proteins in the plasma fraction or for quick-onset protein changes in the PBMC cell fraction. As most gram-negative sepsis infections are from E. coli, we chose the corresponding LPS. LPS from rod shaped bacteria stimulates the specific Toll like receptor 4(TLR4) in the MyD88 pathway. Toll like receptors are part of the innate immune response pathways. Cascades in this pathway involve many signaling events that are either proteolytic cleavages, phosphorylations or other modifications. The large number of human proteins and their associated post-translational modifications (PTM) represent a challenge for MS-based biomarker discovery. To this effect, the simplest sample preparation techniques will provide the most reproducible results. Methods Sample Preparation Blood samples from a healthy single donor were collected into BD Vacutainer™ CPT Cell Separation Tubes (Becton Dickinson) in accordance with IRB approval. Buffers and stimulant solutions were injected directly into the blood collection tubes using a 1 mLsyringe with a 27 ga needle. Control tubes had 200 µL of phosphate buffered saline added and were prepared in parallel to the stimulated tubes. LPS-EB Toll Like Receptor 4 Ligand (InvivoGen, San Diego, CA) was added to a concentration of 100 ng/mL (Low stim) and 10 µg/mL (High stim) of whole blood. After incubation at 37 ºC for 30 min the cells were isolated according to the manufacturer’s instructions for a total exposure time of 60 min. Rinsed cell pellets (~2 mg) were denatured in 350 µL of 8M Urea 300 mMTris-HCl 2.5% n-propanol 10 mMDithiothreitol, reduced/alkylated, diluted to 2 mL with 50 mMTris, 5 mM CaCl2 and digested overnight with 20 µg of Pierce Trypsin Protease, MS Grade. Liquid Chromatography Peptide retention time standards were added and the samples were loaded into 96-well plates onto a Thermo Scientific™ EASY-nLC™ 1000. Separations were done on a Thermo Scientific™ Dionex™ PS-DVB trap column, (5 µm particle, 300Å pore, 150 µm x 12 cm) connected in a “vented t” configuration to a 5 µm particle, 200Å pore C18AQ 100 µm x 50 cm packed tip resolving column in a Thermo Scientific™ Nanospray Flex™ Ion Source on a hybrid Thermo Scientific™ Orbitrap Velos Pro™ MS. Stepped Flow and gradient from 4-50%B at 650 nL/min over 205 min. Buffer A is 2% Methanol 0.2% formic acid, water(v/v). Buffer B is 10% water, 10% isopropanol, 80% acetonitrile 0.2% formic acid (v/v), all solvents are Thermo Scientific™ Optima™ LC-MS grade. Portions of each of the TLR4 digests (Low and High stim) pooled for library creation were fractionated into 12 fractions of 1.8 ml, on a 4.6 mm x 25 cm PS-DVB column 8 µm particle 300A pore, buffer A: 100 mM ammonium formate, 58 mM ammonium hydroxide, Buffer B: 29 mM ammonium hydroxide in 91% acetonitrile 9% water (v/v), using a flow rate of 1 mL/min in a gradient to 45% B (Figure 2). Mass Spectrometry For mass spectrometric analysis, a data-dependent top 25 method has been used . Full MS scans acquired at a resolution of 100,000 using a 1e6 target value, with dependent scans analyzed in the linear ion trap with normal scan resolution. Uncharacterized charge states and + 1 charge states are rejected. Chromatography phase triggering with monoisotopic fitting was used with a peak width of 40 s and a minimum peak threshold of 3.5e4. The maximum inject time allowed for MS/MS scans was set to 100 ms. Dynamic exclusion is turned on using a peak width of 60 s. Data Analysis Full-scan comparisons were made using Pinpoint software, and MS/MS spectra were processed by Proteome Discoverer software using The Mascot® search engine. Two different peptide identification strategies were used. The simple search method (Figure 3) only searches for high-confidence, tryptic peptides and phosphopeptides. The more complex search strategy (Figure 4), breaks the PTM search strategy into multiple nodes, where small groups of PTMs, likely to occur on the same peptide, are searched in each node. This allows for higher-confidence assignments due to the reduced size of each database, albeit at an increased search computational time. Pathway information was processed using Thermo Scientific™ ProteinCenter™ software (not shown). Pinpoint software allows for the import of spectral libraries which can be obtained from data from both unfractionated and fractionated samples provided the chromatography in all samples is reproducible and retention times are consistent. FIGURE 5. Results from different search strategies and any fractionation can then be brought into Pinpoint software through the spectral library function. FIGURE 8. Signal Pathway proteins up-regulated from LPS stimulation. Peptide GGEIEGFR from transforming growth factor beta-1 precursor gi|63025222 [Homo sapiens]. FIGURE 4. Search workflow for multiple modifications. Searches are broken up into groups of most likely to occur modifications. This search strategy is computationally intensive and works best with the high-resolution Orbitrap-analyzed MS2. Many modifications such as ubiquitination, oxidations and deamidations, semi-tryptic, and different databases can be searched even by other search engines without compromising the integrity of the results. FIGURE 9. MyD88 signal pathway proteins up-regulated from LPS stimulation. Peptide QILEGLK from mitogen-activated protein kinase kinase kinase 15 gi|282847398 [Homo sapiens]. • Conclusion • The in vitro whole blood PBMC stimulation model combined with a simple sample preparation workflow strategy allows for a facile and reproducible method of testing cell signaling in the immune response from human research samples. • Spectral Library creation from simple fractionation techniques allows for a large number of different PTMs to be identified without using any specific PTM enrichment strategy. • Pinpoint software allows for targeted quantification in even full scan discovery modes in complex sample mixtures. • Future work will be to utilize the library and initial data to generate a targeted list of peptides for selected reaction monitoring (SRM) workflows on both Thermo Scientific™ TSQ Vantage™ and Thermo Scientific™ Q Exactive™ instruments. These will be to address the low level library peptides that were difficult to quantify in this workflow, but are of interest in the biological pathways that were shown to be up- and down-regulated in these samples and are also correlated with sepsis. • References • Angus DC, Linde-Zwirble WT, Lidicker J, Clermont G, Critical Care Med 2001, (29), 1303-1310 • Robbins Basic Pathology. 8th edition • Mendes ME, Baggio-Zappia GL, Brunialti MK, FernandesMda L, Rapozo MM, Salomao R.Immunobiology, 2011 Mar;216(3):285-95. FIGURE 6. Quantification of the +2 charge state of peptide GDDTPLHLAASHGHR from integrin-linked protein kinase gi|4758606 [Homo sapiens] A) Comparison of Control, Low and High Stimulation B) Alignment of all isotopes. FIGURE 1. MyD88 Pathway A B FIGURE 2. High pH reverse phase fractionation for library peptide fractionation Results In order to allow the detection of differentially expressed proteins and peptides, instrumentation should provide enough quantitative full-scan measurements while simultaneously providing MS/MS fragmentation data to allow sequencing of as many peptides as possible. In this experiment, ca 4000 proteins were identified over 95% confidence containing >250 phosphorylations, >150 ubiquitinylations, peptide oxidations (other than methionine) that were inserted into the Pinpoint spectral library. Pinpoint software has the advantage in that it allows for a selected protein/peptide library import. In this example, all kinases identified in the library can be selected for analysis. Once selected, proteins that are up or down regulated can be highlighted and verified using Pinpoint software (Figures 6, 7). In addition to protein class selection, specific proteins of interest (Figure 8) TGF beta and pathways specific components, (Figure9) MAPKKK 15, can be selected and analyzed for quantification. FIGURE 7. View of the replicates of sample quantifications from the first two isotopes (792.387, green: 792.889, blue) of the peptide GDDTPLHLAASHGHR in Control, Low and High stimulation experiments (pairs, left to right). FIGURE 3. Search workflow for protein phosphorylation. Mascot is a registered trademark of Matrix Science. Vacutainer is a trademark of Becton Dickinson. All other trademarks are the property of Thermo Fisher Scientific and its subsidiaries This information is not intended to encourage use of these products in any manners that might infringe the intellectual property rights of others. For Research Use Only. Not for use in diagnostic procedures.