Download
1 / 13
140 likes | 402 Views
Calculation of approximate intensity distribution due to natural isotope abundance. Organic Structural Spectroscopy by Lambert, Shurvell, Lightner. Organic Structural Spectroscopy by Lambert, Shurvell, Lightner. Molecular formula determination by exact mass measurements. Examples.

E N D
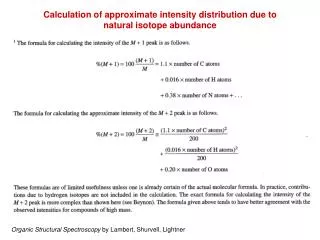
Calculation of approximate intensity distribution due tonatural isotope abundance Organic Structural Spectroscopy by Lambert, Shurvell, Lightner
Organic Structural Spectroscopy by Lambert, Shurvell, Lightner
Molecular formula determination by exact mass measurements Examples The calculated isotope ratios for CO, N2, and C2H4, all of molar mass 28, are as follow: CO 100 (M) 1.14 (M+1) 0.2 (M+2) N2 100 (M) 0.76 (M+1) C2H4 100 (M) 2.26 (M+1) 0.01 (M+2) The calculated isotope ratios for C3H6 and CH2N2, both of molar mass 42, are as follow: C3H6 100 (M) 3.39 (M+1) 0.05 (M+2) CH2N2 100 (M) 1.87 (M+1) 0.01 (M+2)
Calculated isotopic distribution for protonated bovine insulin. The chemical molecular weight based on elemental atomic weights is 5734.6 Da. The molecular weight based on the most abundant isotope of each element is 5728.6 Da, and the molecular weight based on the most abundant isotopic form of the molecule is 5733.6 Da. Different isotope distributions that match the molecule mass 5733.6 Da
Schematic Representation of a Sector Mass Spectrometer Spectroscopic Methods in OC by Hesse, Meier, Zeeh
Mass Analysis for Magnetic Sector MSs Magnetic sectors deflect accelerated beams of ions, with the degree of deflection depending on the mass, the charge, and the velocity of the ion beam. The speed of ions is described by: v = (2zU / m)1/2 z = ionic charge, m = ion mass, U = acceleration potential (V) The mass separation is given by: rm = mv / zB(cm) B = magnetic field strength (T) Both equations can be combined to give the fundamental equation of MS: m/z = B2 rm2 / 2U U and B are kept constant: m/z = constant rm2 U and rm are kept constant: m/z = constant B2 For typical values of Bmax = 1.5 Tesla, rm = 30 cm, and U = 5 kV, the maximum value for m/z is 1953 Da/charge; Metastable ionsare generated by fragmentation after acceleration but before entering the magnetic sector. The position of their diffuse peaks in the mass spectrum is given by: m* = m22/m1 z1/z22 Example: 1,2,3,4-tetrahydrocarbazole (M = 171) looses ethylene and a metastable peak at 1432/171 = 119.6 is observed;
Fragmentation Patterns in EI-MS The fragmentation in EI-MS involves exclusively gas phase unimolecular reactions and is governed by product ion stability. • The relative stabilities of different ions are based on the same chemical models that are also applicable in solution: • Maintenance of an octet of electrons • Localization of charge on the most favourable group/atom • Resonance delocalization • Absence of unpaired electrons charge delocalization
Odd- and even-electron molecular and fragment ions Odd+• can fragment into [even+ + neutral•] or [odd+• + neutral]while even+ fragments into [even++ neutral] but unlikely into [odd+• + neutral•] Exceptions are found for even-electron ions containing particularly week bonds, such as multiple C-Br bonds that undergo successive Br• losses, or when particular stable odd-electron ions are formed.
Stevenson’s Rule for retro Diels-Alder and elimination reactions IE = 9 eV more less IE = 10 eV • product ion enthalpy governs the dissociation pathway • the fragment with the lowest ionization energy will preferentially take the charge • the difference in activation energy equals the difference in IE (ionization energy)
Rearrangement versus simple cleavage • rearrangements are intrinsically slower processes than simple bond cleavages since they involve conformational changes • rearrangements can only compete with bond cleavages if their activation energies and the overall internal ion energies are low • more than one new bond can be formed under low-energy conditions (example to the right)
Charge localization The two molecular radical ions shown above differ in internal energy by about 1.2 eV due to their different IEs. The more electropositive N-atom has the lower IE, therefore the higher internal energy, and is more likely to fragment α-cleavage of an oxygen ether and hetero-bond cleavage of the more polarizable and electropositive thio ether
Remote fragmentations are possible and usually occur via a six-centred transition state (see rearrangements). Other terms Ions in which the charged site is formally separated from the radical site are called distonic ions. Background noise (minor signals at almost every mass) is caused by ions of high internal energy that undergo random bond cleavage. Always Remember No strict rules apply for mass spectral fragmentation, just as they are not for describing product yields in solution phase reactions.