Download
1 / 1
10 likes | 159 Views
Bi. Gr. Du. Du. Du. Gr. Bi. 26th EWGLAM & 11th SRNWP meetings 4th - 7th October 2004,Oslo, Norway Zoran Vakula, Lovro Kalin, Martina Tudor and Stjepan Ivatek-Šahdan Meteorological and Hydrological Service, Grič 3, HR-10000 Zagreb, Croatia

E N D
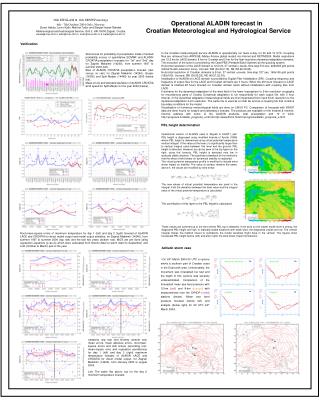
Bi Gr Du Du Du Gr Bi 26th EWGLAM & 11th SRNWP meetings 4th - 7th October 2004,Oslo, Norway Zoran Vakula, Lovro Kalin, Martina Tudor and Stjepan Ivatek-Šahdan Meteorological and Hydrological Service, Grič 3, HR-10000 Zagreb, Croatia vakula@cirus.dhz.hr, kalin@cirus.dhz.hr, tudor@cirus.dhz.hr & ivateks@cirus.dhz.hr Operational ALADIN forecast in Croatian Meteorological and Hydrological Service Verification In the Croatian meteorological service ALADIN is operationally run twice a day, for 00 and 12 UTC. Coupling files are retrieved from ARPEGE (Meteo-France global model) via Internet and RETIM2000. Model resolutions are 12.2 km for LACE domain, 8 km for Croatian and 2 km for the high-resolution dynamical adaptation domains. The execution of the suite is controlled by the OpenPBS (Portable Batch System) as the queuing system. Horizontal resolution of the LACE domain is 12.2 km, 37 vertical -levels, time-step 514 sec, 229x205 grid points (240x216 with extension zone). Corners: SW (34.00,2.18), NE (55.62,39.08). Horizontal resolution of Croatian domains is 8 km, 37 vertical -levels, time-step 327 sec, 169x149 grid points (180x160). Corners: SW (39.00,25), NE (49.57,22.30). Initialisation of ALADIN on LACE domain is provided by Digital Filter Initialisation (DFI). Coupling frequency and frequency of output files for the LACE and Croatian domains are 3 hours. When the 48 hours forecast on LACE domain is finished 48 hours forecast for Croatian domain starts without initialisation with coupling files from LACE. 6 domains for the dynamical adaptation of the wind field in the lower troposphere to 2-km resolution orography for mountainous parts of Croatia. Dynamical adaptation is run sequentially for each output file, with 3 hour interval. In the dynamical adaptation meteorological fields are first interpolated from input 8-km resolution to the dynamical adaptation 2-km resolution. The same file is used as a initial file and as a coupling file that contains boundary conditions for the model. Visualisation of numerous meteorological fields are done on LINUX PC. Comparison of forecasts with SINOP data are done hourly for today's and yesterday’s forecast. The products are available on the Intranet & Internet. Internet address with some of the ALADIN products, total precipitation and 10 m wind: http://prognoza.hr/aladin_prognoza_e.html & http://www.dhmz.htnet.hr/prognoza/aladin_prognoza_e.html. Skill scores for probability of precipitation made of ranked probability scores of quantitative ECMWF and ALADIN CROATIA precipitation forecasts for "1st" and "2nd" day for Zagreb Maksimir (14240), from summer 1997 to summer 2004 (left). Bias of ALADIN CROATIA precipitation forecast (rain versus no rain) for Zagreb Maksimir (14240), Gospic (14330) and Split Marjan (14445) for year 2003 (below left). Mean errors and standard deviation of ALADIN CROATIA wind speed for Split Marjan for the year 2003 (below). PBL height determination Operational version of ALADIN used in Zagreb is AL25T1_op2. PBL height is diagnosed using modified formula of Ayotte (1996) where PBL height is determined using virtual potential temperature vertical integral. If the value at the level z is significantly larger than ts vertical integral value between this level and the ground, PBL height is detected. However, as can be seen in the top figure on the right, using this formula, PBL height is detected very low in statically stable situation. The significant drawback of this method is that the effect of wind shear on dynamical stability is neglected. The virtual potential temperature profile is modified to include wind shear impact on stability. The value at surface remains the same, above it, the values are modified by wind shear. The new values of virtual potential temperatureare used in the integral. First the deviation between the level value and the integral value of the virtual potential temperature is calculated. The contribution of this layer to the PBL height is calculated. These values are summed up to the level where PBL top is detected. If the wind on the lowest model level is strong, the diagnosed PBL height are high. In statically stable situations with weak wind, the diagnosed values are low. The vertical integral makes the method robust to oscillations the model variables might have in the vertical. The figures show forecasted PBL height before (left) and after (right) the wind shear impact introduction. Root-mean-square errors of maximum temperature for day 1 (left) and day 2 (right) forecast of ALADIN LACE and CROATIA for direct model output and model output statistics, for Zagreb Maksimir (14240), from summer 1997 to summer 2004 (top row) and the last two years (bottom row). MOS are are done using regression equations (y=ax+b) which were calculated from historic data for warm (April to September) and cold (October to March) part of the year. Adriatic storm case • On 24th March 2004 03 UTC a cyclone stroke a southern part of Croatian coast in the Dubrovnik area. Unfortunately, the movement was forecasted too fast and the depth of this cyclone was severely underestimated.Comparison of the forecasted mean sea level pressure with 12-km (red) and 8-km (orange) with measurements from the SYNOP (violet) stations (below). Mean sea level pressure forecast (below left) and analysis (below right) for 00 UTC 24th March 2004. Seasonal (top row) and monthly (bottom row) mean errors, mean absolute errors, root-mean-square errors and skill scores (according root-mean-square error and regression persistency) for day 1 (left) and day 2 (right) maximum temperature forecast of ALADIN LACE and CROATIA for direct model output, for Zagreb Maksimir (14240), from January 2003 to august 2004. Left: The same like above, but for the day 2 minimum temperature forecast. Bi Gr Du