Download
1 / 23
230 likes | 531 Views
Costs of the individual firm. Activity 26. M. I. Fortunate?. No! Your true economic profit from going into business for yourself is $-3,000. , and this is a return of -3%.

E N D
Costs of the individual firm Activity 26
M. I. Fortunate? • No! • Your true economic profit from going into business for yourself is $-3,000. , and this is a return of -3%. • The foregone salary of $50,000 and the foregone interest income of $8,000 are opportunity costs, so going into business for herself, cost IM $3,000. • She might not view this as a loss if she places a dollar value on the “psychic income or benefit” of working for herself rather than the corporation
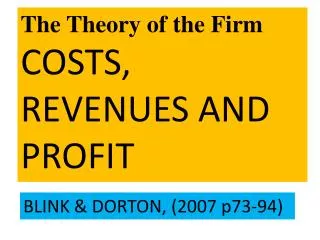
$6,000 AGGREGATE COST DATA $5,500 $5,000 $4,500 $4,000 $3,500 $3,000 AGGREGATE COST $2,500 $2,000 $1,500 $1,000 $500 $100 $200 $300 $400 $500 $600 $700 QUANTITY OF OUTPUT
$6,000 AGGREGATE COST DATA $5,500 TC $5,000 VC $4,500 $4,000 $3,500 $3,000 AGGREGATE COST $2,500 $2,000 $1,500 $1,000 FC $500 $100 $200 $300 $400 $500 $600 $700 QUANTITY OF OUTPUT
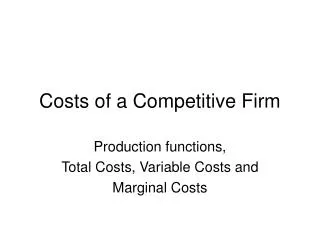
4. How is Marginal Cost represented in the Aggregate Cost Graph?
4. How is Marginal cost represented in the Aggregate Cost Graph? • It is the slope of the Total Cost curve • Move up $700, move over 100 • The rise over the run
$12 UNIT COST DATA NOTE: Marginal Cost is plotted between output levels $11 $10 $9 MC $8 ATC $7 AVC $6 UNIT COST ($ PE R UNIT) $5 $4 $3 $2 $1 AFC 100 200 300 400 500 600 700 QUANTITY OF OUTPUT
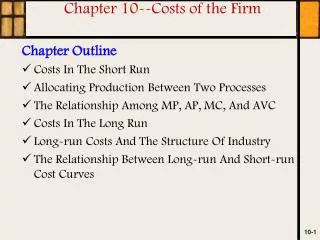
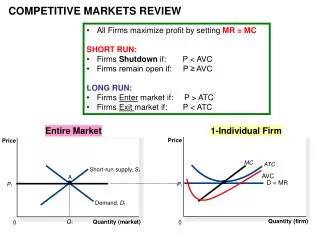
5. On the graph of Unit Cost Data, where is Total Cost per Unit (or Average Total Cost, ATC) at its minimum level of output?
5. On the graph of Unit Cost Data, where is Total Cost per Unit (or Average Total Cost, ATC) at its minimum level of output? • From, or between 500 to 600 units of output
6. On the graph of Unit Cost Data, where is Variable Cost per Unit (or Average Variable Cost, AVC) at its minimum level of output?
6. On the graph of Unit Cost Data, where is Variable Cost per Unit (or Average Variable Cost, AVC) at its minimum level of output? • From or between 300 and 400 units of output
7. On the graph of Unit Cost Data, what is the relationship between Marginal Cost (MC) and Average Total Cost (ATC), when Average Total Cost is at its minimum level of output?
7. On the graph of Unit Cost Data, what is the relationship between Marginal Cost (MC) and Average Total Cost (ATC), when Average Total Cost is at its minimum level of output? • They are equal
8. On the graph of Unit Cost Data, what is the relationship between Marginal Cost (MC) and Average Variable Cost (AVC), when Average Variable Cost is at its minimum level of output?
8. On the graph of Unit Cost Data, what is the relationship between Marginal Cost (MC) and Average Variable Cost (AVC), when Average Variable Cost is at its minimum level of output? • They are equal
9. Explain why marginal cost, on a unit-cost graph, meetsaverage total cost and average variable cost at their minimum points?
9. Explain why marginal cost, on a unit-cost graph, meets average total cost and average variable cost at their minimum points? • By definition • If ATC (TC/Q) and AVC (VC/Q) fall when MC (▲TC/ ▲Q) is below them, as they must and • If ATC (TC/Q) and AVC (VC/Q) rise when MC (▲TC/ ▲Q) is above them, as they must • ERGO - You have to pass through a minimum when you stop falling and start rising • Suppose your quiz average is 4 out of 5. • If on your next quiz (marginal score) you score 3 out of five, your average would drop. • If on the following quiz (marginal score) you score 4 out of 5, your average would rise – as your marginal score has just passed through the minimum level of your average score
10. On the graph of Unit Cost Data, what does the vertical distance between the TC/Q (ATC) curve and the VC/Q (AVC) curve represent?
10. On the graph of Unit Cost Data, what does the vertical distance between the TC/Q (ATC) curve and the VC/Q (AVC) curve represent? • FC/Q or Average Fixed Cost (AFC)
11. Explain why fixed cost has no influence on marginal cost.
11. Explain why fixed cost has no influence on marginal cost. • By definition • Fixed cost does not change as output increases • Marginal cost, by definition, is the change in total cost as output changes • ERGO- fixed cost, which does not change, can have no influence on the changes in cost measured by marginal cost • Marginal cost measures the changes in variable costs as output increases