Spatial Trends in Summer Rainfall: Analyzing 1950-2010 Using Innovative Statistical Methods
10 likes | 124 Views
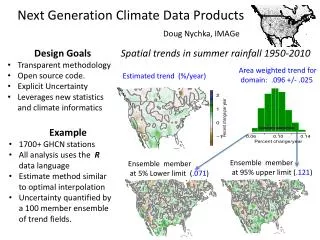
This study presents the spatial trends in summer rainfall from 1950 to 2010, utilizing a transparent, open-source methodology. Drawing on new statistics and climate informatics, this analysis employs R for data processing and an optimal interpolation estimation method to quantify uncertainty. Through over 1,700 GHCN stations, we derive area-weighted trends, with an estimated rate of 0.96% per year (+/- 0.25%). Uncertainty is assessed via a 100-member ensemble, indicating a robust understanding of rainfall trends and their implications for future climate data products.

Spatial Trends in Summer Rainfall: Analyzing 1950-2010 Using Innovative Statistical Methods
E N D
Presentation Transcript
Doug Nychka, IMAGe • Design Goals • Transparent methodology • Open source code. • Explicit Uncertainty • Leverages new statistics and climate informatics Spatial trends in summer rainfall 1950-2010 Area weighted trend for domain: .096 +/- .025 Estimated trend (%/year) Next Generation Climate Data Products • Example • 1700+ GHCN stations • All analysis uses the R data language • Estimate method similar to optimal interpolation • Uncertainty quantified by a 100 member ensemble of trend fields. Ensemble member at 95% upper limit (.121) Ensemble member at 5% Lower limit (.071)


![d ata[0]](https://cdn1.slideserve.com/3300577/slide1-dt.jpg)