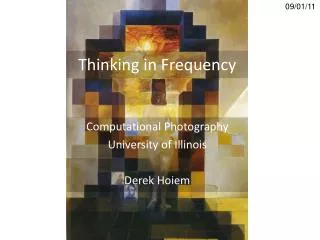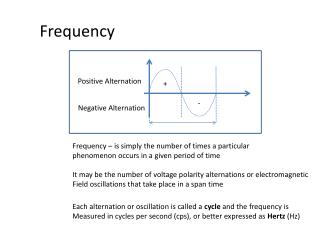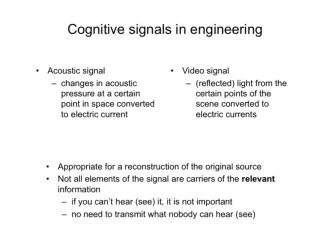
Thinking in Frequency
01/26/12. Thinking in Frequency. Computer Vision University of Illinois Derek Hoiem. Dali: “Gala Contemplating the Mediterranean Sea” (1976). Review: image filtering. 1. 1. 1. 1. 1. 1. 1. 1. 1. Credit: S. Seitz. Review: image filtering. 1. 1. 1. 1. 1. 1. 1. 1. 1.

Thinking in Frequency
E N D
Presentation Transcript
01/26/12 Thinking in Frequency Computer Vision University of Illinois Derek Hoiem Dali: “Gala Contemplating the Mediterranean Sea” (1976)
Review: image filtering 1 1 1 1 1 1 1 1 1 Credit: S. Seitz
Review: image filtering 1 1 1 1 1 1 1 1 1 Credit: S. Seitz
Review: image filtering 1 1 1 1 1 1 1 1 1 Credit: S. Seitz
Review: image filtering 1 1 1 1 1 1 1 1 1 Credit: S. Seitz
Review: image filtering 1 1 1 1 1 1 1 1 1 Credit: S. Seitz
Review: image filtering 1 1 1 1 1 1 1 1 1 Credit: S. Seitz
Review: image filtering in spatial domain 1 0 -1 2 0 -2 1 0 -1 Sobel
Today’s Class • Fourier transform and frequency domain • Frequency view of filtering • Sampling
Why does the Gaussian give a nice smooth image, but the square filter give edgy artifacts? Gaussian Box filter
Hybrid Images • A. Oliva, A. Torralba, P.G. Schyns, “Hybrid Images,” SIGGRAPH 2006
Why do we get different, distance-dependent interpretations of hybrid images? ?
Why does a lower resolution image still make sense to us? What do we lose? Image: http://www.flickr.com/photos/igorms/136916757/
Jean Baptiste Joseph Fourier (1768-1830) ...the manner in which the author arrives at these equations is not exempt of difficulties and...his analysis to integrate them still leaves something to be desired on the score of generality and even rigour. had crazy idea (1807): Anyunivariate function can be rewritten as a weighted sum of sines and cosines of different frequencies. • Don’t believe it? • Neither did Lagrange, Laplace, Poisson and other big wigs • Not translated into English until 1878! • But it’s (mostly) true! • called Fourier Series • there are some subtle restrictions Laplace Legendre Lagrange
A sum of sines Our building block: Add enough of them to get any signal f(x) you want!
Frequency Spectra • example : g(t) = sin(2πf t) + (1/3)sin(2π(3f) t) = + Slides: Efros
Frequency Spectra = + =
Frequency Spectra = + =
Frequency Spectra = + =
Frequency Spectra = + =
Frequency Spectra = + =
Example: Music • We think of music in terms of frequencies at different magnitudes
Other signals • We can also think of all kinds of other signals the same way Cats(?) xkcd.com FFT of my cat Tesla
Fourier analysis in images Intensity Image Fourier Image http://sharp.bu.edu/~slehar/fourier/fourier.html#filtering
Signals can be composed + = http://sharp.bu.edu/~slehar/fourier/fourier.html#filtering More: http://www.cs.unm.edu/~brayer/vision/fourier.html
Strong Vertical Frequency (Sharp Horizontal Edge) Diagonal Frequencies Strong Horz. Frequency (Sharp Vert. Edge) Log Magnitude Low Frequencies
Fourier Transform • Fourier transform stores the magnitude and phase at each frequency • Magnitude encodes how much signal there is at a particular frequency • Phase encodes spatial information (indirectly) • For mathematical convenience, this is often notated in terms of real and complex numbers Amplitude: Phase: Euler’s formula:
Computing the Fourier Transform Continuous Discrete k = -N/2..N/2 Fast Fourier Transform (FFT): NlogN
The Fourier transform of the convolution of two functions is the product of their Fourier transforms The inverse Fourier transform of the product of two Fourier transforms is the convolution of the two inverse Fourier transforms Convolution in spatial domain is equivalent to multiplication in frequency domain! The Convolution Theorem
Properties of Fourier Transforms • Linearity • Fourier transform of a real signal is symmetric about the origin • The energy of the signal is the same as the energy of its Fourier transform See Szeliski Book (3.4)
Filtering in spatial domain 1 0 -1 2 0 -2 1 0 -1 * =
Filtering in frequency domain FFT FFT = Inverse FFT
FFT in Matlab • Filtering with fft • Displaying with fft im = ... % “im” should be a gray-scale floating point image [imh, imw] = size(im); fftsize = 1024; % should be order of 2 (for speed) and include padding im_fft = fft2(im, fftsize, fftsize); % 1) fft im with padding hs = 50; % filter half-size fil = fspecial('gaussian', hs*2+1, 10); fil_fft = fft2(fil, fftsize, fftsize); % 2) fft fil, pad to same size as image im_fil_fft = im_fft .* fil_fft; % 3)multiply fft images im_fil = ifft2(im_fil_fft); % 4) inverse fft2 im_fil = im_fil(1+hs:size(im,1)+hs, 1+hs:size(im, 2)+hs); % 5) remove padding figure(1), imagesc(log(abs(fftshift(im_fft)))), axis image, colormap jet
Questions Which has more information, the phase or the magnitude? What happens if you take the phase from one image and combine it with the magnitude from another image?
Filtering Why does the Gaussian give a nice smooth image, but the square filter give edgy artifacts? Gaussian Box filter
Sampling Why does a lower resolution image still make sense to us? What do we lose? Image: http://www.flickr.com/photos/igorms/136916757/
Subsampling by a factor of 2 • Throw away every other row and column to create a 1/2 size image
Aliasing problem • 1D example (sinewave): Source: S. Marschner
Aliasing problem • 1D example (sinewave): Source: S. Marschner
Aliasing problem • Sub-sampling may be dangerous…. • Characteristic errors may appear: • “Wagon wheels rolling the wrong way in movies” • “Checkerboards disintegrate in ray tracing” • “Striped shirts look funny on color television” Source: D. Forsyth
Aliasing in video Slide by Steve Seitz
Aliasing in graphics Source: A. Efros
Nyquist-Shannon Sampling Theorem • When sampling a signal at discrete intervals, the sampling frequency must be 2 fmax • fmax = max frequency of the input signal • This will allows to reconstruct the original perfectly from the sampled version good v v v bad