Download
1 / 25
250 likes | 348 Views
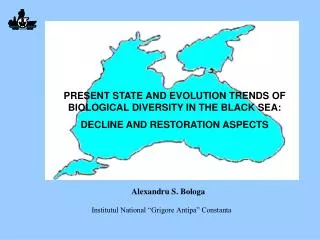
PRESENT STATE AND EVOLUTION TRENDS OF THE ROMANIAN BLACK SEA COASTAL ENVIRONMENT. Dr.Eng. S. Nicolaev et al. National Institute for Marine Research & Development “Grigore Antipa”, Mamaia 300, RO-900581, Constanta 3, Romania, E-mail: <office@alpha.rmri.ro>.

E N D
PRESENT STATE AND EVOLUTION TRENDS OF THE ROMANIAN BLACK SEA COASTALENVIRONMENT Dr.Eng. S. Nicolaev et al. National Institute for Marine Research & Development “Grigore Antipa”, Mamaia 300, RO-900581, Constanta 3, Romania, E-mail: <office@alpha.rmri.ro>
STATE OF PHYSICAL – CHEMICAL INDICATORS General indicators TEMPERATURE • e.g. Constanta: normal limits compared to reference period 1961-2004 • positive deviations: Jan +2.30 C, Aug +2.00 C • annual mean: 0.80 C > multiannual mean 1961-2004
STATE OF LITTORAL AND COASTAL ZONE Indicators of coastal zone COASTAL PROCESSES • erosion / dynamic equilibrium / accretion • statistical grouping (classification) in classes of intensity and evolutionary trend: Em – medium errosion Es – week errosion ED – dynamic equilibrium As – week accretion Am – medium accretion • 3 sectors (Sulina-Corbu, Navodari-Mamaia, Eforie-Vama Veche)
SEA LEVEL • very high values compared to reference period 1933-2004 • due to precipitations / floods and increased Danube flow (discharge) • mean annual value in 2005 32.4 cm = maximum annual mean for whole period of reference 1933-2004 (100% higher than mean 1933-2004)
SALINITY • e.g. Constanta: significant deviations from multiannual values 1996-2004 due to abundant precipitions / increase of Danube flow (discharge) • maximum: 19.49 g/l Apr • minimum: 6.9 g/l May, Jul, Sep
DISSOLVED O2 • usual large spectrum of concentrations between 75.5 – 496.4 µM • marked seasonal variations due to changes of thermic regime • good oxygenation ofcoastal waters, proven by O2saturation values (frequently 110% over saturation values)
Eutrophication indicatorsNUTRIENTS • strongly influenced by Danube flow (discharge) of 271.8 km3 (compared to 1959-2004 multiannual mean of 205.7 km3) • increase of all nutrient concentrations (sometimes exceeding those between 1996-2004) • total inorganic N:< 8 µM compared to 1996-2004 • P: mean annual level 0.54 µM P-PO4(twice higher than in 2004) • Si: <3 µM than 2004 (mean concentration 14.9 µM Si-SiO4)
CHLOROPHYLL a • indicator of phytoplankton abundance and biomass in marine waters • e.g. Constanta: shore 0.10 – 25.96 µg/l monthly means 1.06-8.87 µg/l maximum and minimummonthly mean Aug • slight exceeding of annual mean content in coastal waters (5.05 µg/l) compared to 2003-2004, but > 2001 (5.39 µg/l)and 2002 (5.97 µg/l)
Indicators of contaminationHEAVY METALS • mean annual values in water / sediment (increasing trend of Pb concentration in ecosystem components along entire Romanian coast) Cu 16.26 µg/l57.96 µg/g Ca 1.98 µg/l 2.26 µg/g Pb 14.91 µg/l76.86 µg/g Ni 2.90 µg/l49.11 µg/g Cr 5.58 µg/l19.16 µg/g • mean content in coastal water higher than reference levels in ۥ80ies • no significant impact of heavy metal accumulation on state of health of mussel (Mytilus galloprovincialis): Cu 4.60 µg/g Cd 0.29 µg/g Pb3.39 µg/g Ni 4.55 µg/g
TOTAL HYDROCARBONS • concentration range between 58.5 – 3,535.4 µg/l seawater (95.6 % of samples > 100 µg/l) 10.5 – 21,599 µg/g sediment (88.3 % of samples > 100 µg/l) • 2.7 times decrease of concentrations compared to reference period 1996-1998 • trend of chronical pollution
POLYAROMATIC HYDROCARBONS (PAHs) • high variation range of concentrations • increase of total PAHs in seawater along the southerncoast between 2003-2005 • increase of 9.9 times in seawater and 4.6 times insediments in 2005 compared to 2004, in some locations
ORGANOCHLORINE PESTICIDES (OCPs) • occurence of high variety of OCPs • usual concentrations up to: 1 µg/l in sea water 1 µg/g in dry sediment • occasional higher concentrations(up to 7.95 µg/l at Mangalia) • up to 2 times higher values in sea water in 2005 (compared to 2003-2004), possibly due to major floods • concentrations up to 2 µg/g dry weight in marine bivalves
STATE OF MARINE ECOSYSTEM Indicators of eutrophication PHYTOPLANKTON • 178 species / 7 taxonomic groups 69% Diatoms 22% Dinoflagellates + Chlorophyta 9% Others • marine + marine-brackishwater 58% freshwater + freshwater- brackishwater42% • density 6 times lower and biomass 3.6 times lower than multiannual mean value for 1983-1990
PHYTOPLANKTONIC BLOOMS • reduced, both numerically and as number of mass species • 6 blooms > 5 million cells/l 4 > 10 million cells/l (2 in 2004) • dominant species Aphanizomenon flos-aquae (45 mill. cells/l) Microcystis orae (200 mill. cells/l) Cyclotella caspia (19 mill. cells/l)
ZOOPLANKTON • 30 species / 16 taxonomic groups • trophic zooplankton maximum density 117.225 ind./m3 biomass 2,378.34 mg/m3 (Mamaia / Jun) • nontrophic zooplankton density and biomass 20 times higher than trophic zooplankton(in summer), same as in 2004 • exotic species: Mnemiopsis leidyi only • endangered species: Pontella mediterranea and Centropages ponticus (following normalization trend)
MACROPHYTOBENTHOS • 33 species 16 Chlorophyta 5 Phaeophyta 10 Rhodophyta 2 Phanerogama • biomasses e.g. / Enteromorpha13.22 g fresh weight/m2 Cladophora5.39 Ceramium18.9 Polysiphonia12.77 • sporadic occurence of Desmarestia (exotic brown alga) • reappearance of red algae Lomentaria (Vama Veche) and Phyllophora (Constanta) • considerable development / deposits of strandedmacrophytes, up to 15-350 m3 dry weight, alongsouthern littoral between Jun-Jul
ZOOBENTHOS • 60 (comparative to 41-55 species between 2003-2005, or to 16-28 species in early ۥ90ies !), at 5 to 20 m depths • increases of about 29 times of mean density and 9 times of mean biomass values, respectively, compared to 2004 • dominance of small and medium sized individuals of mussel (M. gallopro-vincialis), and occurence of highsized ones (northern sector)
Indicators of contaminationMICROBIOLOGICAL LOAD • concentrations of enterobacteria [total coliforms (CT), faecal coliforms (CF) and faecal streptococci (SF)] fluctuated in bathing waters during summer / tourism season between limits foreseen by national norms and EU Directives • zones under direct impact / influence of waste waterdischarges evinced highest values of bacterial indicators • frequence of exceeding admissible or recomended concentrations in some bathing areas by 12% for CT and CF, and 28% for SF (disrespect of hygienic–sanitary norms by tourists and increased river water input under specific hydro-meteorological conditions in 2005)
STATE OF ENDANGERED SPECIES Indicators for biodiversity and habitats RED LIST • Macrophytes • Invertebrates • Fish • Mammals • 209 species 19 macrophytes (9%) 45 invertebrates (22%) 141 fish (67%) 4 mammals (2%) • improvement of Cystoseira barbata populations
total species about2,926 endangered and vulnerable species 29 (same 2004) habitat diversity classifiedin (cf. EU Directives) 4 types / water column 8 types / substratum 586,188 ha wetlands (6,188 ha in Constanta county) pressure:14 exotic species 8 commercial species (2 mollusks + 6 fish) 11 anthropic activities impact:no. endangered species / no. total species 29/2,926 no. dissapeared species / no. total species 13/2,926 single acclimated species: Mugil soiuyi response: no. protected species / no. total species12/2,926 no. protected areas / total length of coastline5/254 total surface of protected areas12,606.98 ha: 11,335 ha of scientific significance 1,226.98 ha of scientific and zoological importance 35 ha zoology 8 ha botany and zoology - biggest protected area: Danube Delta Biosphere Reserve(with own Management plan) Vama Veche - 2 Mai Marine Reserve under custody of NIMRD (Functioning statute and Management plan in progress) BIODIVERSITY AND HABITATS
STATE OF FISH STOCKSIndicators for living resources • STATE • stock biomass sprat 60,000 t (>2003-2004 / 45,000 t) • intensity of reproduction estimated relative abundanceof sprat eggs, between1995- 2005,0.289x109 to 178.651x10⁹ • population structure 25 species (17 for industrial fishing)
STATE OF FISH STOCKSIndicators for living resources PRESSURE • sea water temperature • phytoplankton blooms and decomposition of Microcystis orae • fishing effort (similar to 2003 and 2004) - stationary / 1,840 trammel nets 7,200 turbot gill nets 300 mullet gill nets 30 trap nets 16 beach seines 3,100 longlines 230 shad gill nets - active / 8 operational coastal trawlers • total catch 1,940 t (510 + 1,430 t) 20.3% > 2003, 5.9% > 2004 • total admissible catch (TAC) I identical 2003-2004
State and evolution trends of Romanian Black Sea coastal environment continued to be monitored in 2005 from physical, chemical and biological point of view compared with reference periods dating back in early ۥ60ies or more recent years depending on parametres. Coastal processes during the geomorphological cycle 2004-2005 have been dominated by dynamic equilibrium (41%) and erosion (40%) compared to accretion (19%). Sea level indicated very high values compared to reference period 1933-2004, in correlation with precipitations, floods and increased Danube flow (discharge) Considerable decrease of salinity in May, July and September much below usual limits relates as well to increase of Danube flow. Nutrient (N, P, Si) and chlorophyll a concentrations, major indicators of eutrophication, increased compared to last years, occasionally exceeding those between 1996-2004, due to above mentioned reason. Some indicators of contamination, such as heavy metals, total hydrocarbons, PAHs and OCPs exceeded occasionaly previously encountered reference concentrations. CONCLUSIONS
Bioaccumulation of contaminants in edible bivalve mollusks did not affect their state of health. Slight improvement of state of marine ecosystem signaled end ۥ90ies, beginning 2000, continued to be proved by: decrease of phytoplankton densities / biomasses and related blooms, comparable densities / biomasses of Centropages ponticus with those prior to eutrophication, reinstallment of Cystoseira barbata belts off Vama Veche, increase of macrozoobenthic specific diversity (up to 60 species compared to fewer number in ۥ90ies till 2004). Concentrations of enterobacteria (total coliforms, faecal coliforms, faecal streptococci) exceeded between 12 to 28% national and EC previsions, due tocertain local disrespect of hygienic-sanitary norms and specific hydro-meteorological conditions. Revised Red List of macrophytes, invertebrates, fish and mammals totalized same 209 species as in 2004. Biodiversity and habitats continued to be characterized by specific decision indicators (state, pressure, impact, response). State of living resources / fish stocks has been surveyed taking into consideration evolution of state, pressure and impact indicators. New versus historical reference data concerning present state and evolution trends of the Romanian coastal environment do constitute contributions for a joint „Report on the state of the Black Sea”. CONCLUSIONS (cont’d)