Comprehensive Testing of 872 UV LEDs: Insights from CALICE Collaboration Meeting
This report details the extensive testing of 872 UV LEDs, conducted as part of the CALICE Collaboration Meeting at McGill University, Montréal. The study utilized an advanced measurement setup involving multiple channels and fibers to assess the LEDs' performance. Key findings include stability metrics over various time scales, temperature correction impacts, and light response variations among the LEDs. Preliminary selection criteria based on consistent performance were established, identifying a reliable subset of 532 LEDs. Insights from this study aim to enhance the overall reliability and efficiency of LED applications in experimental setups.

Comprehensive Testing of 872 UV LEDs: Insights from CALICE Collaboration Meeting
E N D
Presentation Transcript
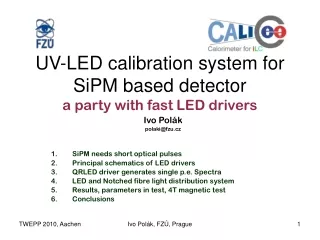
UV LED quality test All 872 UV LEDs tested Selection is about to finish Jaroslav Zalesak Institute of Physics ASCR, Prague CALICE Collaboration Meeting, McGill Uni, Montréal, Québec, CA
Measurement setup • LED Driver pulses – UV LED – opt. fibers – APD – preamp – scope • Measured by scope of 4 channels/fibers for each LED (semi-automatic procedure) • @ different positions (diff radius: 0.58, 1.15, 1.76 mm) wrt. central LED point • Light source asymmetric wrt. LED central point • Phi response variations • Zero angle position uncertainty • reproducibility 5% CALICE Collaboration Meeting, McGill Uni, Montréal, Québec, CA
UV LED (400nm) characteristics Zero position setup uncertainty Good linearity behavior 2-3% Temperature correction change of APG gain (10) w/ T CALICE Collaboration Meeting, McGill Uni, Montréal, Québec, CA
UV LEDs Response – full sample 872 LEDs (I) • after light calibration and temperature corrections CALICE Collaboration Meeting, McGill Uni, Montréal, Québec, CA
UV LEDs Response – full sample 872 LEDs (II) • response normalized to the average over all LEDs (summed up all fibers) • visible decrease of response for beginning of data taking • but not correlated with LEDs themselves CT = 1 - 0.1 * (T-To) -2 K Temp +2 K CALICE Collaboration Meeting, McGill Uni, Montréal, Québec, CA
Single LED time stability • long time stability: over 20% decrease of fiber light response • middle time stability: RMS 5% (reproducibility) • short time stability: 1.5-2% LED w/o touching (= statistics) CALICE Collaboration Meeting, McGill Uni, Montréal, Québec, CA
Study of time stability to be corrected • divide into 2 parts: Y=A + B * (x-x0) [slope] Y=A for x>x0 [const] • fit 3 parameters: A,B and break point x0 • vary for each fiber Preliminary: • break points are similar 650±40 day 30 fiber 3 fiber 11 CALICE Collaboration Meeting, McGill Uni, Montréal, Québec, CA
Selection criteria • Preliminary: only “constant” part i.e. 532 LEDs • within range of ±15% 82% of LEDs • RMS = 13% • additional (redundant) criteria: variation range for each fiber = 12.7% CALICE Collaboration Meeting, McGill Uni, Montréal, Québec, CA
Conclusion • All UV LEDs (872 in our hands) were tested • “no name” leds look reasonable! • in general: LED light emission show same characteristics similar behavior • decrease of response @ first measured leds is probably due to instability of the measured equipment (aging,..) than degradation of light of LEDs themselves apply correction for each channel/fiber with function of const + slope line • main selection criterion based on led light variation being within range ± 15% in ‘const’ sub-sample of 532 leds 82% satisfied 1.35 highest/lowest emission • for entire LED system the PINs watch of LED response important to keep its time and temperature stability • distribution of one LED light into single fibers (up to 100% of lowest->highest yield) rather important than overall variation of light among leds CALICE Collaboration Meeting, McGill Uni, Montréal, Québec, CA