Download
1 / 19
190 likes | 405 Views
The report segments the hydrogen market on the basis of production and delivery (merchant and captive production), production process (steam reforming of coal, steam reforming of natural gases, partial oxidation of hydrocarbons, and electrolysis of water), and application (petroleum refinery, chemical production, food processing, pharmaceutical, metal processing and others).

E N D
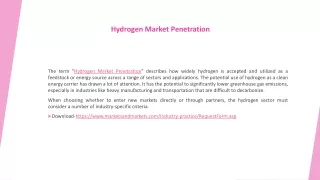
HydrogenMarket-GlobalStudyonHydrogen:Electrolysis SegmenttoWitnessHighestGrowthby2020 of Water PersistenceMarketResearch GlobalHydrogenMarketWillReach324.8 billionCubicMetersinTermsofVolumeand US$141.4BillionbyValue,in2020: PersistenceMarketResearch 1 PersistenceMarketResearch
HydrogenMarket-GlobalStudyonHydrogen:ElectrolysisofWater SegmenttoWitnessHighestGrowthby2020 PersistenceMarketResearchReleasedNewMarketReport“GlobalMarketStudyon Hydrogen:ElectrolysisofWaterSegmenttoWitnessHighestGrowthby2020”,the globalhydrogenmarketwasvaluedat255.3billioncubicmetersintermsofvolumeandUSD 96.6billionintermsofvaluein2013.ItisexpectedtogrowataCAGRof3.5%and5.6%for volumeandvaluerespectivelyfrom2014to2020,toreachanof324.8billioncubicmetersin termsofvolumeandUSD141.4billionintermsofvalueby2020. BrowsethefullGlobalMarketStudyonHydrogen:ElectrolysisofWaterSegmenttoWitness HighestGrowthby2020reportathttp://www.persistencemarketresearch.com/market-research/hydrogen-market.asp Growingsecondaryend-userindustriesandincreasinguseofhydrogeninrefineryhydro- processingaresomeofthemajorfactorsfuellingthegrowthofthehydrogenmarketfor hydrogenfuelcellvehicles.Sincehydrogenisusedinpetroleumrefiningprocesses,the industryisimpactedbyunstablegrowthofthelatter.However,increasingdemandforclean transportation(thereasonforunstablegrowthofpetroleumrefiningindustries)issupporting growthofthehydrogenmarketintermsofincreasingdemandforhydrogenfuelstations. Hydrogenisusedinpetroleumhydro-treatingandhydro-crackingintherefineryindustry. Demandforhydrogeninpetroleumrefininghasincreasedsignificantlyoverthelastfewyears owingtostringentmotorvehicleemissionsregulationsimposedbyvariousgovernments. Developedcountriesfollowthelatestemissionregulations,whereasdevelopingcountries frequentlyreviseregulations. AsiaPacificisthelargestmarketforhydrogenglobally.Increasingdemandfromcountriessuch asIndiaandChinacoupledwithincreasinguseofhydrogeninsecondaryend-userindustriesis expectedtopropelthegrowthoftheAsiaPacificmarket.Someofthemajorfactors contributingtothegrowthofhydrogenmarketinNorthAmericaincludestringentmotor vehicleemissionregulationsimposedindevelopedcountries,includingtheU.S.This,inturn,is increasingdemandforlow-sulfurandultralow-sulfurgasolineanddieselfuels.Moreover,rising needtoreducecarboncontentintheatmosphereisoneofthemajorfactorsdrivingthe hydrogenmarketinEurope. Inthisreport,thehydrogenmarketissegmentedintoproductionanddelivery(merchantand captiveproduction),productionprocess(steamreformingofcoal,steamreformingofnatural gases,partialoxidationofhydrocarbons,andelectrolysisofwater),andapplication(petroleum refinery,chemicalproduction,foodprocessing,pharmaceutical,metalprocessingandothers). Thesearerepresentedintermsofvolume(billioncubicmeters),value(USDbillion),and regionssuchasNorthAmerica(theU.S.andCanada),Europe(WesternandEasternEurope), AsiaPacific(China,India,andJapan),andRestoftheWorld. 2 PersistenceMarketResearch
HydrogenMarket-GlobalStudyonHydrogen:ElectrolysisofWater SegmenttoWitnessHighestGrowthby2020 Globalhydrogenmarketgrewfrom232.0billioncubicmetersin2010to255.3billioncubic metersin2013ataCAGRof3.2%intermsofvolume.ThemarketgrewfromUSD82.6in2010 toUSD96.6ataCAGRof5.3%intermsofvalue.Undertheregionalsegment,theAsiaPacific hydrogenmarket(thelargestmarketin2013)increasedby6.8%CAGRduring2010–2013to reach81.1billioncubicmetersin2013intermsofvolume.ThemarketexpandedataCAGRof 7.3%toreachUSD29.2billionin2013intermsofvalue. TheLindeGroupdominatedtheglobalhydrogenmarketwith20%sharein2013,followedby AirLiquideS.A.andPraxair,Inc.with18%and12%sharesrespectively.OthermajorcompaniesoperatingintheglobalhydrogenmarketareMesserGroupGmbH,Airgas,Inc., TaiyoNipponSansoCorporation,IwataniCorporation,HydrogenicsCorporation, andChemicals,Inc.,andShowaDenkoK.K. AirProducts •Hydrogenproductionprocesssegmentation •Gasificationofcoal •Steamreformingofnaturalgases •Partialoxidationofhydrocarbons •Electrolysisofwater •Hydrogenapplicationsegmentation •Petroleumrefinery •Chemicalproduction •Ammoniaproduction •Methanolproduction •Foodprocessing •Pharmaceutical •Metalprocessing •Others •Thereportcoversgeographicsegmentation •NorthAmerica •TheU.S. •Canada •Europe •WesternEurope •EasternEurope •AsiaPacific •China •India •Japan RestoftheWorld 3 PersistenceMarketResearch
HydrogenMarket-GlobalStudyonHydrogen:ElectrolysisofWater SegmenttoWitnessHighestGrowthby2020 MarketHistory: Growingsecondaryend-userindustriesandincreasinguseofhydrogeninrefineryhydro-processingare someofthemajorfactorsfuellingthegrowthofthehydrogenmarketforhydrogenfuelcellvehicles.Since hydrogenisusedinpetroleumrefiningprocesses,theindustryisimpactedbyunstablegrowthofthe latter.However,increasingdemandforcleantransportation(thereasonforunstablegrowthofpetroleum refiningindustries)issupportinggrowthofthehydrogenmarketintermsofincreasingdemand forhydrogenfuelstations.Hydrogenisusedinpetroleumhydro-treatingandhydro-crackinginthe refineryindustry.Demandforhydrogeninpetroleumrefininghasincreasedsignificantlyoverthelast fewyearsowingtostringentmotorvehicleemissionsregulationsimposedbyvariousgovernments. Developedcountriesfollowthelatestemissionregulations,whereasdevelopingcountries frequentlyrevise regulations. AsiaPacificwasthelargestmarketforhydrogenin2013,accountingfor31.7%and30.3%oftheglobal marketshareintermsofvolumeandvaluerespectively.ItwasfollowedbyNorthAmericawithmarket sharesof29.4%(volume)and29.7%(value)andEuropewithmarketsharesof24.5%(volume)and 25.2%(value).From2014to2020,theAsiaPacifichydrogenmarketisexpectedtoexpandataCAGRof 7.0%,owingtoincreasingdemandfromcountriessuchasIndiaandChina.Risinguseofhydrogenin secondaryend-userindustriesisexpectedtopropelthegrowthoftheAsiaPacificmarket.Themarket shareofNorthAmericaisexpectedtodecreaseto25.7%and26.9%intermsofvolumeandvalue respectively.ThemarketshareofEuropeisexpectedtodecreaseto21.2%and23.5%intermsofvolume andvaluerespectively. Thehydrogenmarketissegmentedintoproductionanddelivery(merchantandcaptiveproduction), productionprocess(gasificationofcoal,steamreformingofnaturalgases,partialoxidationof hydrocarbons,andelectrolysisofwater),andapplication(petroleumrefinery,chemicalproductionof ammoniaandmethanol,foodprocessing,pharmaceutical,metalprocessing,andothers).Thecaptive productionanddeliverysegmentheldthelargestmarketin2013at220.8billioncubicmetersintermsof volumeandUSD84.1billionintermsofvalue.Theelectrolysisofwaterproductionprocessisexpectedto witnessthehighestCAGRof6.6%duringtheforecastperiodtoreach17.1billioncubicmetersby2020. TheLindeGroupdominatedtheglobalhydrogenmarketwith20%sharein2013,followedbyAirLiquide S.A.andPraxair,Inc.with18%and12%sharesrespectively.Othermajorcompaniesoperatinginthe 4 PersistenceMarketResearch
HydrogenMarket-GlobalStudyonHydrogen:ElectrolysisofWater SegmenttoWitnessHighestGrowthby2020 globalhydrogenmarketareMesserGroupGmbH,Airgas,Inc.,TaiyoNipponSansoCorporation,Iwatani Corporation,HydrogenicsCorporation,AirProductsandChemicals,Inc.,andShowaDenkoK.K. TableofContent Chapter1Preface 1.1ReportDescription 1.2ScopeandDefinition 1.2.1Segmentscoveredinthereport 1.3ResearchMethodology Chapter2MarketSynopsis Chapter3Porter’sFiveForcesAnalysis 3.1BargainingPowerofSuppliers 3.2BargainingPowerofBuyers 3.3ThreatofSubstitutes 3.4ThreatofNewEntrants 3.5RivalryamongCompetitors Chapter4MarketOverview 4.1Introduction 4.2MarketDrivers 4.2.1Increasingdemandforhydrogenfromrefineryhydro-processingindustry 4.2.2Growingsecondaryend-userindustries 4.2.3Power-to-Gasconcept 4.3ImpactAnalysisforDrivers 4.4Restraints 4.4.1Unstableglobaloilrefiningcapacity 4.4.2Fuelcellend-usersegmentforhydrogenisfacingchallengesfrom substitutes 4.5ImpactAnalysisforRestraints 4.6Opportunities itsexisting 5 PersistenceMarketResearch
HydrogenMarket-GlobalStudyonHydrogen:ElectrolysisofWater SegmenttoWitnessHighestGrowthby2020 4.6.1Environmentallegislationsareincreasinghydrogenconsumptionforpurificationand higherqualityproducts 4.6.2Increasingdemandforon-siteandcaptivehydrogenproductionholdssignificant opportunityfortheglobalhydrogenmarket 4.7MarketTrends 4.7.1ArtificialleafTechnologyhasbeenevolvingasacleanmethodofhydrogengeneration Chapter5MarketSizeandForecastbyProductionandDelivery 5.1MerchantProduction 5.2CaptiveProduction Chapter6MarketSizeandForecastbyProductionProcess 6.1GasificationofCoal 6.2SteamReformingofNaturalGases 6.3PartialOxidationofHydrocarbons 6.4ElectrolysisofWater Chapter7MarketSizeandForecastbyApplication 7.1PetroleumRefinery 7.2ChemicalProduction 7.3FoodProcessing 7.4Pharmaceutical 7.5MetalProcessing Chapter8MarketSizeandForecastbyGeography 8.1NorthAmerica 8.1.1TheU.S. 8.1.1.1Marketoverview 8.1.2Canada 8.1.2.1Marketoverview 8.2Europe 8.2.1WesternEurope 6 PersistenceMarketResearch
HydrogenMarket-GlobalStudyonHydrogen SegmenttoWitnessHighestGrowthby2020 : Electrolysis of Water 8.2.1.1Marketoverview 8.2.2EasternEurope 8.2.2.1Marketoverview 8.3AsiaPacific 8.3.1China 8.3.1.1Marketoverview 8.3.2India 8.3.2.1Marketoverview 8.3.3Japan 8.3.3.1Marketoverview 8.4RestoftheWorld(RoW) Chapter9CompetitiveScenario Chapter10CompanyProfiles 10.1AirLiquideS.A. 10.1.1Companyoverview 10.1.2Productsandservices 10.1.3Financialperformance 10.1.4Recentdevelopments 10.2MesserGroupGmbH 10.2.1Companyoverview 10.2.2Productsandservices 10.2.3Financialperformance 10.2.4Recentdevelopments 10.3Airgas,Inc. 10.3.1Companyoverview 10.3.2Productsandservices 10.3.3Financialperformance 10.3.4Recentdevelopments 10.4LindeAG 10.4.1Companyoverview 7 PersistenceMarketResearch
HydrogenMarket-GlobalStudyonHydrogen SegmenttoWitnessHighestGrowthby2020 : Electrolysis of Water 10.4.2Productsandservices 10.4.3Financialperformance 10.4.4RecentDevelopments 10.5Praxair,Inc. 10.5.1Companyoverview 10.5.2Productsandservices 10.5.3Financialperformance 10.5.4Recentdevelopments 10.6TaiyoNipponSansoCorporation 10.6.1Companyoverview 10.6.2Productsandservices 10.6.3Financialperformance 10.6.4RecentDevelopments 10.7IwataniCorporation 10.7.1Companyoverview 10.7.2Productsandservices 10.7.3Financialperformance 10.7.4Recentdevelopments 10.8HydrogenicsCorporation 10.8.1Companyoverview 10.8.2Productsandservices 10.8.3Financialperformance 10.8.4Recentdevelopments 10.9AirProductsandChemicals,Inc. 10.9.1Companyoverview 10.9.2Productsandservices 10.9.3Financialperformance 10.9.4Recentdevelopments 10.10ShowaDenkoK.K. 10.10.1Companyoverview 10.10.2Productsandservices 10.10.3Financialperformance 8 PersistenceMarketResearch
HydrogenMarket-GlobalStudyonHydrogen:ElectrolysisofWater SegmenttoWitnessHighestGrowthby2020 10.10.4Recentdevelopments ListofTables TABLE1Globalhydrogenmarketsnapshot,byvolume,2014and2020 TABLE2Globalhydrogenmarketsnapshot,byvalue,2014and2020 TABLE3Naturalgasproductionandconsumptioninmajorhydrogenproducingregions,2012 and2013(billioncubicmeters) TABLE4Hydrogenplantvariableandfixedcosts,byplantcapacity(millionstandardcubicfeet perday) TABLE5Driversforhydrogenmarket:Impactanalysis TABLE6Restraintsforhydrogenmarket:Impactanalysis TABLE7Globalhydrogenmarketsize,byproductionanddelivery,2010–2013(billioncubic meters) TABLE8Globalhydrogenmarketsize,byproductionanddelivery,2014–2020(billioncubic meters) TABLE9Globalhydrogenmarketsize,byproductionanddelivery,2010–2013(USDbillion) TABLE10Globalhydrogenmarketsize,byproductionanddelivery,2014–2020(USDbillion) TABLE11Globalhydrogenmarketsize,bytheproductionprocess,2010–2013(billioncubic meters) TABLE12Globalhydrogenmarketsize,bythepproductionprocess,2014–2020(billioncubic meters) TABLE13Globalhydrogenmarketsize,btheroductionprocess,2010–2013(USDbillion) TABLE14Globalhydrogenmarketsize,bytheroductionprocess,2014–2020(USDbillion) TABLE15Globalhydrogenmarketsize,byapplication,2010–2013(billioncubicmeters) TABLE16Globalhydrogenmarketsize,byapplication,2014–2020(billioncubicmeters) TABLE17Globalhydrogenmarketsize,byapplication,2010–2013(USDbillion) TABLE18Globalhydrogenmarketsize,byapplication,2014–2020(USDbillion) TABLE19Globalchemicalproductionmarketsize,byapplication,2010–2013(billioncubic meters) TABLE20Globalchemicalproductionmarketsize,byapplication,2014–2020(billioncubic meters) TABLE21Globalchemicalproductionmarketsize,byapplication,2010–2013(USDbillion) 9 PersistenceMarketResearch
HydrogenMarket-GlobalStudyonHydrogen:ElectrolysisofWater SegmenttoWitnessHighestGrowthby2020 TABLE22Globalchemicalproductionmarketsize,byapplication,2014–2020(USDbillion) TABLE23Globalhydrogenmarketsize,byregion,2010–2013(billioncubicmeters) TABLE24Globalhydrogenmarketsize,byregion,2014–2020(billioncubicmeters) TABLE25Globalhydrogenmarketsize,byregion,2010–2013(USDbillion) TABLE26Globalhydrogenmarketsize,byregion,2014–2020(USDbillion) TABLE27NorthAmericanhydrogenmarketsize,bycountry,2010–2013(billioncubicmeters) TABLE28NorthAmericanhydrogenmarketsize,bycountry,2014–2020(billioncubicmeters) TABLE29NorthAmericanhydrogenmarketsize,bycountry,2010–2013(USDbillion) TABLE30NorthAmericanhydrogenmarketsize,bycountry,2014–2020(USDbillion) TABLE31NorthAmericanhydrogenmarketsize,byproductionanddelivery,2010–2013 (billioncubicmeters) TABLE32NorthAmericanhydrogenmarketsize,byproductionanddelivery,2014–2020 (billioncubicmeters) TABLE33NorthAmericanhydrogenmarketsize,byproductionanddelivery,2010–2013(USD billion) TABLE34NorthAmericanhydrogenmarketsize,byproductionanddelivery,2014–2020(USD billion) TABLE35NorthAmericanhydrogenmarketsize,byproductionprocess,2010–2013(billion cubicmeters) TABLE36NorthAmericanhydrogenmarketsize,byproductionprocess,2014–2020(billion cubicmeters) TABLE37NorthAmericanhydrogenmarketsize,byproductionprocess,2010–2013(USD billion) TABLE38NorthAmericanhydrogenmarketsize,byproductionprocess,2014–2020(USD billion) TABLE39NorthAmericanhydrogenmarketsize,byapplication,2010–2013(billioncubic meters) TABLE40NorthAmericanhydrogenmarketsize,byapplication,2014–2020(billioncubic meters) TABLE41NorthAmericanhydrogenmarketsize,byapplication,2010–2013(USDbillion) TABLE42NorthAmericanhydrogenmarketsize,byapplication,2014–2020(USDbillion) 10 PersistenceMarketResearch
HydrogenMarket-GlobalStudyonHydrogen:ElectrolysisofWater SegmenttoWitnessHighestGrowthby2020 TABLE43TheU.S.hydrogenmarketsize,byproductionanddelivery,2010–2013(billion cubicmeters) TABLE44TheU.S.hydrogenmarketsize,byproductionanddelivery,2014–2020(billion cubicmeters) TABLE45TheU.S.hydrogenmarketsize,byproductionanddelivery,2010–2013(USD billion) TABLE46TheU.S.hydrogenmarketsize,byproductionanddelivery,2014–2020(USD billion) TABLE47TheU.S.hydrogenmarketsize,byproductionprocess,2010–2013(billioncubic meters) TABLE48TheU.S.hydrogenmarketsize,byproductionprocess,2014–2020(billioncubic meters) TABLE49TheU.S.hydrogenmarketsize,byproductionprocess,2010–2013(USDbillion) TABLE50TheU.S.hydrogenmarketsize,byproductionprocess,2014–2020(USDbillion) TABLE51TheU.S.hydrogenmarketsize,byapplication,2010–2013(billioncubicmeters) TABLE52TheU.S.hydrogenmarketsize,byapplication,2014–2020(billioncubicmeters) TABLE53TheU.S.hydrogenmarketsize,byapplication,2010–2013(USDbillion) TABLE54TheU.S.hydrogenmarketsize,byapplication,2014–2020(USDbillion) TABLE55Canadianhydrogenmarketsize,byproductionanddelivery,2010–2013(billion cubicmeters) TABLE56Canadianhydrogenmarketsize,byproductionanddelivery,2014–2020(billion cubicmeters) TABLE57Canadianhydrogenmarketsize,byproductionanddelivery,2010–2013(USD billion) TABLE58Canadianhydrogenmarketsize,byproductionanddelivery,2014–2020(USD billion) TABLE59Canadianhydrogenmarketsize,byproductionprocess,2010–2013(billioncubic meters) TABLE60Canadianhydrogenmarketsize,byproductionprocess,2014–2020(billioncubic meters) TABLE61Canadianhydrogenmarketsize,byproductionprocess,2010–2013(USDbillion) TABLE62Canadianhydrogenmarketsize,byproductionprocess,2014–2020(USDbillion) 11 PersistenceMarketResearch
HydrogenMarket-GlobalStudyonHydrogen:ElectrolysisofWater SegmenttoWitnessHighestGrowthby2020 TABLE63Canadianhydrogenmarketsize,byapplication,2010–2013(billioncubicmeters) TABLE64Canadianhydrogenmarketsize,byapplication,2014–2020(billioncubicmeters) TABLE65Canadianhydrogenmarketsize,byapplication,2010–2013(USDbillion) TABLE66Canadianhydrogenmarketsize,byapplication,2014–2020(USDbillion) TABLE67Europeanhydrogenmarketsize,byregion,2010–2013(billioncubicmeters) TABLE68Europeanhydrogenmarketsize,byregion,2014–2020(billioncubicmeters) TABLE69Europeanhydrogenmarketsize,byregion,2010–2013(USDbillion) TABLE70Europeanhydrogenmarketsize,byregion,2014–2020(USDbillion) TABLE71Europeanhydrogenmarketsize,byproductionanddelivery,2010–2013(billion cubicmeters) TABLE72Europeanhydrogenmarketsize,byproductionanddelivery,2014–2020(billion cubicmeters) TABLE73Europeanhydrogenmarketsize,byproductionanddelivery,2010–2013(USD billion) TABLE74Europeanhydrogenmarketsize,byproductionanddelivery,2014–2020(USD billion) TABLE75Europeanhydrogenmarketsize,byproductionprocess,2010–2013(billioncubic meters) TABLE76Europeanhydrogenmarketsize,byproductionprocess,2014–2020(billioncubic meters) TABLE77Europeanhydrogenmarketsize,byproductionprocess,2010–2013(USDbillion) TABLE78Europeanhydrogenmarketsize,byproductionprocess,2014–2020(USDbillion) TABLE79Europeanhydrogenmarketsize,byapplication,2010–2013(billioncubicmeters) TABLE80Europeanhydrogenmarketsize,byapplication,2014–2020(billioncubicmeters) TABLE81Europeanhydrogenmarketsize,byapplication,2010–2013(USDbillion) TABLE82Europeanhydrogenmarketsize,byapplication,2014–2020(USDbillion) TABLE83WesternEurope (billioncubicmeters) TABLE84WesternEurope (billioncubicmeters) TABLE85WesternEurope (USDbillion) hydrogen market size, by production and delivery, 2010 – 2013 hydrogen market size, by production and delivery, 2014 – 2020 hydrogen market size, by production and delivery, 2010 – 2013 12 PersistenceMarketResearch
HydrogenMarket-GlobalStudyonHydrogen:ElectrolysisofWater SegmenttoWitnessHighestGrowthby2020 TABLE86WesternEuropehydrogenmarketsize,byproductionanddelivery,2014–2020 (USDbillion) TABLE87WesternEuropehydrogenmarketsize,byproductionprocess,2010–2013(billion cubicmeters) TABLE88WesternEuropehydrogenmarketsize,byproductionprocess,2014–2020(billion cubicmeters) TABLE89WesternEuropehydrogenmarketsize,byproductionprocess,2010–2013(USD billion) TABLE90WesternEuropehydrogenmarketsize,byproductionprocess,2014–2020(USD billion) TABLE91WesternEuropehydrogenmarketsize,byapplication,2010–2013(billioncubic meters) TABLE92WesternEuropehydrogenmarketsize,byapplication,2014–2020(billioncubic meters) TABLE93WesternEuropehydrogenmarketsize,byapplication,2010–2013(USDbillion) TABLE94WesternEuropehydrogenmarketsize,byapplication,2014–2020(USDbillion) TABLE95EasternEuropehydrogenmarketsize,byproductionanddelivery,2010–2013 (billioncubicmeters) TABLE96EasternEuropehydrogenmarketsize,byproductionanddelivery,2014–2020 (billioncubicmeters) TABLE97EasternEuropehydrogenmarketsize,byproductionanddelivery,2010–2013(USD billion) TABLE98EasternEuropehydrogenmarketsize,byproductionanddelivery,2014–2020(USD billion) TABLE99EasternEuropehydrogenmarketsize,byproductionprocess,2010–2013(billion cubicmeters) TABLE100EasternEuropehydrogenmarketsize,byproductionprocess,2014–2020(billion cubicmeters) TABLE101EasternEuropehydrogenmarketsize,byproductionprocess,2010–2013(USD billion) TABLE102EasternEuropehydrogenmarketsize,byproductionprocess,2014–2020(USD billion) 13 PersistenceMarketResearch
HydrogenMarket-GlobalStudyonHydrogen:ElectrolysisofWater SegmenttoWitnessHighestGrowthby2020 TABLE103EasternEuropehydrogenmarketsize,byapplication,2010–2013(billioncubic meters) TABLE104EasternEuropehydrogenmarketsize,byapplication,2014–2020(billioncubic meters) TABLE105WesternEuropehydrogenmarketsize,byapplication,2010–2013(USDbillion) TABLE106EasternEuropehydrogenmarketsize,byapplication,2014–2020(USDbillion) TABLE107AsiaPacifichydrogenmarketsize,bycountry,2010–2013(billioncubicmeters) TABLE108AsiaPacifichydrogenmarketsize,bycountry,2014–2020(billioncubicmeters) TABLE109AsiaPacifichydrogenmarketsize,bycountry,2010–2013(USDbillion) TABLE110AsiaPacifichydrogenmarketsize,bycountry,2014–2020(USDbillion) TABLE111AsiaPacifichydrogenmarketsize,byproductionanddelivery,2010–2013(billion cubicmeters) TABLE112AsiaPacifichydrogenmarketsize,byproductionanddelivery,2014–2020(billion cubicmeters) TABLE113AsiaPacifichydrogenmarketsize,byproductionanddelivery,2010–2013(USD billion) TABLE114AsiaPacifichydrogenmarketsize,byproductionanddelivery,2014–2020(USD billion) TABLE115AsiaPacifichydrogenmarketsize,byproductionprocess,2010–2013(billioncubic meters) TABLE116AsiaPacifichydrogenmarketsize,byproductionprocess,2014–2020(billioncubic meters) TABLE117AsiaPacifichydrogenmarketsize,byproductionprocess,2010–2013(USD billion) TABLE118AsiaPacifichydrogenmarketsize,byproductionprocess,2014–2020(USD billion) TABLE119AsiaPacifichydrogenmarketsize,byapplication,2010–2013(billioncubicmeters) TABLE120AsiaPacifichydrogenmarketsize,byapplication,2014–2020(billioncubicmeters) TABLE121AsiaPacifichydrogenmarketsize,byapplication,2010–2013(USDbillion) TABLE122AsiaPacifichydrogenmarketsize,byapplication,2014–2020(USDbillion) TABLE123Chinesehydrogenmarketsize,byproductionanddelivery,2010–2013(billioncubicmeters) 14 PersistenceMarketResearch
HydrogenMarket-GlobalStudyonHydrogen:ElectrolysisofWater SegmenttoWitnessHighestGrowthby2020 TABLE124Chinesehydrogenmarketsize,byproductionanddelivery,2014–2020(billion cubicmeters) TABLE125Chinesehydrogenmarketsize,byproductionanddelivery,2010–2013(USD billion) TABLE126Chinesehydrogenmarketsize,byproductionanddelivery,2014–2020(USD billion) TABLE127Chinesehydrogenmarketsize,byproductionprocess,2010–2013(billioncubic meters) TABLE128Chinesehydrogenmarketsize,byproductionprocess,2014–2020(billioncubic meters) TABLE129Chinesehydrogenmarketsize,byproductionprocess,2010–2013(USDbillion) TABLE130Chinesehydrogenmarketsize,byproductionprocess,2014–2020(USDbillion) TABLE131Chinesehydrogenmarketsize,byapplication,2010–2013(billioncubicmeters) TABLE132Chinesehydrogenmarketsize,byapplication,2014–2020(billioncubicmeters) TABLE133Chinesehydrogenmarketsize,byapplication,2010–2013(USDbillion) TABLE134Chinesehydrogenmarketsize,byapplication,2014–2020(USDbillion) TABLE135Indianhydrogenmarketsize,byproductionanddelivery,2010–2013(billioncubic meters) TABLE136Indianhydrogenmarketsize,byproductionanddelivery,2014–2020(billioncubic meters) TABLE137Indianhydrogenmarketsize,byproductionanddelivery,2010–2013(USDbillion) TABLE138Indianhydrogenmarketsize,byproductionanddelivery,2014–2020(USDbillion) TABLE139Indianhydrogenmarketsize,byproductionprocess,2010–2013(billioncubic meters) TABLE140Indianhydrogenmarketsize,byproductionprocess,2014–2020(billioncubic meters) TABLE141Indianhydrogenmarketsize,byproductionprocess,2010–2013(USDbillion) TABLE142Indianhydrogenmarketsize,byproductionprocess,2014–2020(USDbillion) TABLE143Indianhydrogenmarketsize,byapplication,2010–2013(billioncubicmeters) TABLE144Indianhydrogenmarketsize,byapplication,2014–2020(billioncubicmeters) TABLE145Indianhydrogenmarketsize,byapplication,2010–2013(USDbillion) TABLE146Indianhydrogenmarketsize,byapplication,2014–2020(USDbillion) 15 PersistenceMarketResearch
HydrogenMarket-GlobalStudyonHydrogen:ElectrolysisofWater SegmenttoWitnessHighestGrowthby2020 TABLE147Japanesehydrogenmarketsize,byproductionanddelivery,2010–2013(billion cubicmeters) TABLE148Japanesehydrogenmarketsize,byproductionanddelivery,2014–2020(billion cubicmeters) TABLE149Japanesehydrogenmarketsize,byproductionanddelivery,2010–2013(USD billion) TABLE150Japanesehydrogenmarketsize,byproductionanddelivery,2014–2020(USD billion) TABLE151Japanesehydrogenmarketsize,byproductionprocess,2010–2013(billioncubic meters) TABLE152Japanesehydrogenmarketsize,byproductionprocess,2014–2020(billioncubic meters) TABLE153Japanesehydrogenmarketsize,byproductionprocess,2010–2013(USDbillion) TABLE154Japanesehydrogenmarketsize,byproductionprocess,2014–2020(USDbillion) TABLE155Japanesehydrogenmarketsize,byapplication,2010–2013(billioncubicmeters) TABLE156Japanesehydrogenmarketsize,byapplication,2014–2020(billioncubicmeters) TABLE157Japanesehydrogenmarketsize,byapplication,2010–2013(USDbillion) TABLE158Japanesehydrogenmarketsize,byapplication,2014–2020(USDbillion) TABLE159RoWhydrogenmarketsize,byproductionanddelivery,2010–2013(billioncubic meters) TABLE160RoWhydrogenmarketsize,byproductionanddelivery,2014–2020(billioncubic meters) TABLE161RoWhydrogenmarketsize,byproductionanddelivery,2010–2013(USDbillion) TABLE162RoWhydrogenmarketsize,byproductionanddelivery,2014–2020(USDbillion) TABLE163RoWhydrogenmarketsize,byproductionprocess,2010–2013(billioncubic meters) TABLE164RoWhydrogenmarketsize,byproductionprocess,2014–2020(billioncubic meters) TABLE165RoWhydrogenmarketsize,byproductionprocess,2010–2013(USDbillion) TABLE166RoWhydrogenmarketsize,byproductionprocess,2014–2020(USDbillion) TABLE167RoWhydrogenmarketsize,byapplication,2010–2013(billioncubicmeters) TABLE168RoWhydrogenmarketsize,byapplication,2014–2020(billioncubicmeters) 16 PersistenceMarketResearch
HydrogenMarket-GlobalStudyonHydrogen:ElectrolysisofWater SegmenttoWitnessHighestGrowthby2020 TABLE169RoWhydrogenmarketsize,byapplication,2010–2013(USDbillion) TABLE170RoWhydrogenmarketsize,byapplication,2014–2020(USDbillion) TABLE171NetsalesandEBITDAofMesserGroupGmbH,2011-2013(millionEuro) TABLE172Airgas,Inc.’sproducts,bycategory TABLE173NetsalesandnetincomeofTNSC,2012-2014(millionYen) TABLE174SalesandnetincomeofIwataniCorporation,2012-2014(millionYen) TABLE175HydrogenicsCorporation’shydrogenbrands,bybusinesssegments TABLE176NetsalesandnetincomeofShowaDenkoK.K.,2011-2013(millionYen) ListofFigures FIG.1Globalhydrogenmarket,2010–2020(billioncubicmeters) FIG.2Globalhydrogenmarket,2010–2020(USDbillion) FIG.3Hydrogenmarket:Porter’sfiveforcesanalysis FIG.4GlobalChemicalindustriesrevenueshare,byregion,2013 FIG.5Globaloilrefiningcapacity,byregion,1000barrels/calendarday,2011–2013 FIG.6Globalmerchantproductionmarket,2010–2020(billioncubicmeters) FIG.7Globalmerchantproductionmarket,2010–2020(USDbillion) FIG.8Globalcaptiveproductionmarket,2010–2020(billioncubicmeters) FIG.9Globalcaptiveproductionmarket,2010–2020(USDbillion) FIG.10Globalgasificationofcoalmarket,2010–2020(billioncubicmeters) FIG.11Globalgasificationofcoalmarket,2010–2020(USDbillion) FIG.12Globalsteamreformingofnaturalgasesmarket,2010–2020(billioncubicmeters) FIG.13Globalsteamreformingofnaturalgasesmarket,2010–2020(USDbillion) FIG.14Globalpartialoxidationofhydrocarbonsmarket,2010–2020(billioncubicmeters) FIG.15Globalpartialoxidationofhydrocarbonsmarket,2010–2020(USDbillion) FIG.16Globalelectrolysisofwatermarket,2010–2020(billioncubicmeters) FIG.17Globalelectrolysisofwatermarket,2010–2020(USDbillion) FIG.18Globalpetroleumrefinerymarket,2010–2020(billioncubicmeters) FIG.19Globalpetroleumrefinerymarket,2010–2020(USDbillion) FIG.20Globalchemicalproductionmarket,2010–2020(billioncubicmeters) FIG.21Globalchemicalproductionmarket,2010–2020(USDbillion) FIG.22Globalfoodprocessingmarket,2010–2020(billioncubicmeters) 17 PersistenceMarketResearch
HydrogenMarket-GlobalStudyonHydrogen:ElectrolysisofWater SegmenttoWitnessHighestGrowthby2020 FIG.23Globalfoodprocessingmarket,2010–2020(USDbillion) FIG.24Globalpharmaceuticalmarket,2010–2020(billioncubicmeters) FIG.25Globalpharmaceuticalmarket,2010–2020(USDbillion) FIG.26Globalmetalprocessingmarket,2010–2020(billioncubicmeters) FIG.27Globalmetalprocessingmarket,2010–2020(USDbillion) FIG.28Globalhydrogenmarketshare,byregion,2013and2020(billioncubicmeters) FIG.29Globalhydrogenmarketshare,byregion,2013and2020(USDbillion) FIG.30Hydrogenmarket,marketshare,bycompany,2013 FIG.31NetrevenueandnetincomeofAirLiquideS.A.,2011−2013(USDmillion) FIG.32NetsalesandEBITDAofMesserGroupGmbH.,2011−2013(USDmillion) FIG.33NetsalesandnetearningsofAirgas,Inc.,2012−2014(USDmillion) FIG.34RevenueandnetprofitofTheLindeGroup,2011−2013(USDmillion) FIG.35SalesandnetincomeofPraxair,2012−2014(USDmillion) FIG.36NetsalesandnetincomeofTNSC,2012−2014(USDmillion) FIG.37SalesandnetincomeofIwataniCorporation,2012−2014(USDmillion) FIG.38SalesandnetlossofHydrogenicsCorporation,2011−2013(USDmillion) FIG.39SalesandnetincomeofAirProductsandChemicals,Inc.,2012−2014(USDmillion) FIG.40NetsalesandnetincomeofShowaDenkoK.K.,2011−2013(USDmillion) AboutUs: PersistenceMarketResearchisaglobalmarketresearchfirmspecializing-syndicatedresearch,customresearch,andconsultingservices AtPersistenceMarketResearch(PMR),weareinthebusinessofacceleratingyourbusiness.Asafull- servicemarketresearchfirm,westandcommittedtobringingmoreaccuracyandspeedtoyourbusiness decisions.Fromready-to-purchasemarketresearchreportstocustomizedglobalresearchsolutions,our engagementmodelsarehighlyflexiblewithoutcompromisingonourdeep-seatedresearchvalues. Brieflystated,ourmissionistogiveyouaccesstoforecastsandtrendsanalysesthatputyouonthe pathto profitability. PMR’sServicesGoBeyondGleaningData 18 PersistenceMarketResearch
HydrogenMarket-GlobalStudyonHydrogen:ElectrolysisofWater SegmenttoWitnessHighestGrowthby2020 MostenterprisesbelievethatITanddatabasesareenoughtomakeanaccuratedecision.Whilewedo notdisputethat,considerthis:Howlongdoesittaketomakeanaccurate decision?Westrivetodeliverbothevenwithdemandingdeadlines. andstrategicmillion-dollar ContactUs: AddieThomes 305Broadway 7thFloor,NewYorkCity, NY10007,UnitedStates, USA-CanadaTollFree:800-961-0353 Email:sales@persistencemarketresearch.com Web:http://www.persistencemarketresearch.com Twitter:https://twitter.com/addiethomes Blog:http://persistencemarketresearchblog.wordpress.com/ 19 PersistenceMarketResearch