Download
1 / 33
330 likes | 448 Views
Building Science Assessments for State-Level Nutrient Reduction Stategies. Effects of Conservation Tillage Systems on Dissolved Phosphorus Dr. David Baker Heidelberg University Tiffin, Ohio 44883 November 15, 2012 Davenport, IA. This talk -- .

E N D
Building Science Assessments for State-Level Nutrient Reduction Stategies Effects of Conservation Tillage Systems on Dissolved Phosphorus Dr. David Baker Heidelberg University Tiffin, Ohio 44883 November 15, 2012 Davenport, IA
This talk -- Lessons learned from agricultural phosphorus control programs in the Lake Erie Basin The teacher has been: Detailed, long-term monitoring data for several major watersheds draining into Lake Erie. Information on changing crop production practices in those watersheds. This research was supported by state and federal agencies, foundations , agribusinesses and the fertilizer industry . Special thanks to the EPA’s Great Lakes National Program Office and the Great Lakes Protection Fund for recent support for bioavailability studies and phosphorus stratification studies.
15 stations All at USGS Stream Gages Today’s data from three rivers: Maumee – 6,330 sq.mile Sandusky – 1,250 sq. mile Cuyahoga - 708 sq. mile
Analytical Program at the NCWQR Program Characteristics: • Suspended solids • Total phosphorus • Dissolved reactive phosphorus • Nitrate • Nitrite • Ammonia • Total Kjeldahl Nitrogen • Chloride • Sulfate • Silica • Fluoride • Conductivity • Seasonally pesticides • Selected metals • Bioavailable Phosphorus • Program started in 1975 • ~ 500 samples analyzed per station per year • Annual loads calculated by integration with corrections for final USGS daily discharge • Data available at Heidelberg’s web site: http://www.heidelberg.edu/academiclife/distinctive/ncwqr/data
Management Options for Phosphorus Load Reduction Focus of reduction programs Total ParticulatePhosphorusLoad Total Dissolved PhosphorusLoad Total PhosphorusLoad = + TotalBioavailablePhosphorusLoad BioavailableParticulatePhosphorusLoad BioavailableDissolvedPhosphorusLoad = +
Nonpoint phosphorus control programs were planned in the 1980s and initiated in the 1990s. Dissolved Phosphorus 18% Forms of phosphorus transported in northwestern Ohio rivers, 1975-1987. Particulate phosphorus during storm runoff is attached to soil particles. ParticulatePhosphorus82% Phosphorus reduction programs focused on reducing erosion and particulate phosphorus loading through fostering adoption of no-till and reduced till crop protection methods.
What does the water quality monitoring data look like? What changes in agricultural practices could explain the loading changes? What changes in hydrology could help explain the loading changes?
Trends in annual loads and flow weighted mean concentrations of particulate phosphorus in the Maumee and Sandusky rivers
Note the close relationship between variations in annual discharge and variations in TP load. • Discharge increased by 41% while TP load increased by 31%. • Weather and hydrology drive nonpoint pollution from cropland.
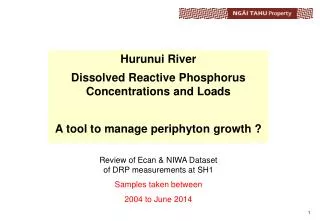
Trends in annual loads and flow weighted mean concentrations of dissolved reactive phosphorus in the Maumee and Sandusky rivers
Dissolved Reactive Phosphorus 50% decrease from 1982-2011 Total Phosphorus 24% decrease from 1982-2011
From here With some very good years in between! To here
Phosphorus reduction programs in the Lake Erie Basin have been driven by the lake’s eutrophication problems. Point source control problems were initiated first and quickly resulted in substantial reductions in phosphorus loading.
How does nutrient export from the Northwestern Ohio rivers compare with the export from other areas? • Maumee and Sandusky • 26% of land area • 51% of total phos. load • Export rate 3x higher than average for rest of drainage area
Tillage Practices in the Sandusky Watershed: 2009-2010 “Rotational no till”
Phosphorus fertilizer sales in Ohio, 1955-2007 Heidelberg Monitoring started
Long-term trend in average phosphorus soil tests in Northwest Ohio Start of Heidelberg monitoring
How will the majority of phosphorus fertilizer be applied to this field? Sandusky Watershed Soil Stratification Studies
Total Phosphorus Loading Total Bioavailable Phosphorus Loading
A bottom line … After 20+ years of efforts to reduce phosphorus loading to Lake Erie from cropland, we now have more bioavailable phosphorus entering Lake Erie from cropland than ever. 2. The increases in bioavailable phosphorus loading are due to increases in dissolved phosphorus runoff. 3. The increases in dissolved phosphorus loading appear to be contributing increased harmful algal blooms in Lake Erie.
Characteristics of average annual export of phosphorus from the Sandusky River, 2002-2011 Total Phosphorus (594 metric tons/year) 73% particulate phosphorus27% dissolved phosphorus • Management choice impacts-- • Trading • TMDLs • BMP selection 93% bioavailable 29% bioavailable Bioavailable Phosphorus (275 metric tons/year) 46% particulate phosphorus54% dissolved phosphorus
Why has the dissolved phosphorus loading from the Sandusky and Maumee rivers dropped and then increased so much? Potential causes of the increasing dissolved phosphorus export • increasing fall and winter broadcasting of phosphorus fertilizers, often without timely incorporation. 2. phosphorus stratification in the soil associated with widespread adoption of no-till and reduced-till production and the accompanying lack of inversion tillage. 3. increased tile drainage coupled with macropore flow that carries surface water to tile drains and increases total discharge. 4. increasing trends in flashiness of northwestern Ohio streams. 5. changes in rainfall patterns that have resulted in increases in winter rainstorms and resulting stream flows, especially in December and January.
Phosphorus stratification in cropland of the Sandusky Watershed
Sample Pretreatment BioavailableForms PortionAnalyzed acidadded oxidant added auto-clave x x x Total Phosphorus (TP) whole sample Dissolved Phosphorus (DP) (filter sample through 0.45 micron filter) --- --- --- Dissolved Reactive P (DRP) filtrate --- x x Dissolved Hydrolyzable P (DHP) filtrate x x x Total Dissolved P (TDP) filtrate Dissolved Organic P (DOP) calculated as TDP - DHP Particulate Phosphorus (PP) calculated as TP - TDP (extract residue on filter with NaOHand analyze as DRP) NaOH Extractable PP all samples extra analyses for bioavailability studies NCWQRPhosphorusAnalyses