Download

1 / 24
240 likes | 358 Views
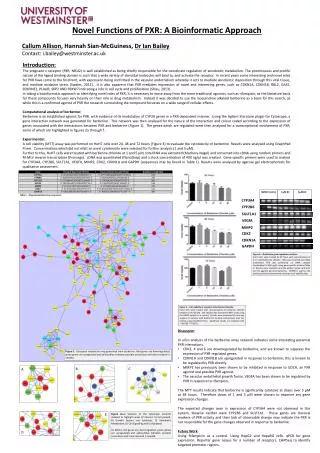
A Novel Approach for Analyzing Kinetic Data from Variants of a Calcium-Binding Protein. Third Biennial Undergraduate Statistics Project Competition 2011. Research Focus.

E N D
A Novel Approach for Analyzing Kinetic Data from Variants of a Calcium-Binding Protein Third Biennial Undergraduate Statistics Project Competition 2011
Research Focus The overall focus of this project is to gain a more precise understanding of the physiological role of the sarcoplasmic calcium-binding protein (SCP) in invertebrate muscle relaxation. • In the species studied (the freshwater crayfish Procambarusclarkii), this protein is composed of two subunits, each of which has three calcium-binding sites. • Two of these sites bind calcium (Ca2+) exclusively. • Four of these sites can bind Ca2+ or magnesium. Calcium-Specific Sites Single SCP Subunit Calcium/Magnesium Sites
Muscle Contraction/Relaxation • For each muscle cell, contraction is triggered by the release of large quantities of Ca2+from intracellular storage sites. This molecule interacts with and activates a series of proteins, which leads to the generation of force. • For relaxation to occur, Ca2+must be returned to the storage sites. The exact pathway by which this occurs is currently unknown. • In invertebrates, SCP has been proposed to assist with the contraction/relaxation cycle by one of two mechanisms: • SCP actively transports calcium from the cytoplasm back to storage. This role directly promotes muscle relaxation. • SCP acts as a Ca2+-buffer, meaning that it binds Ca2+ but does not interact with other proteins. This allows it to regulate the total level of Ca2+ present during contraction/relaxation cycles without directly promoting relaxation.
Prior Work • Three variants of SCP have been identified in P. clarkii (pcSCP1a, pcSCP1b, pcSCP1c). • Reducing the amount of pcSCP in living P. clarkiicauses significant deficits in their level of activity and physical response to stimulation (Two sample T test, T = 3.86, p-value = 0.002). • pcSCP has been found to be highly expressed in tail muscle tissue. However, studies of the expression patterns of pcSCP variants have revealed no distinctions between the variants in different tissues (ANOVA block design, F = 0.9638, p-value = 0.3868).
This Project • The purpose of this project has been to characterize the Ca2+-binding kinetics of pcSCP, in order to determine if the difference between these protein variants is biochemical. • For all three variants of pcSCP, protein has been isolated and kinetic data has been collected. Three approaches have been utilized for the analysis of these data: • A formal comparison of the kinetic behavior for each variant using statistical inference techniques. • Determine and compare the kinetic parameters of pcSCP calcium-binding activity using dose-response curve fitting. • Compare the overall behavior of pcSCP variants using principal components and multivariate classification techniques.
Biochemical Isolation of pcSCP • E. coli was transformed with variant-specific pcSCPcDNA, and expression of the variants was induced in high quantities by exposure to IPTG. • pcSCP proteins were separated from E. coli proteins by liquid chromatography. • A • B E. coli proteins (impurities) pcSCP1c Impurites • Analysis of pcSCP1c purity. The dark bands signify proteins of different sizes; the arrow indicates the band which represents pcSCP. (A) All protein collected from E. coli prior to purification. (B) pcSCP1c collected after purification.
Tryptophan Fluorescence • The amino acid tryptophan, which is a part of most proteins, is capable of fluorescing (a measureable phenomenon) after exposure to certain wavelengths of light. • The fluorescence of molecules is highly sensitive to environmental changes. • Combining these two facts, tryptophan fluorescence is commonly used for kinetic experiments. In this study, changes in fluorescent spectra were considered to be indicative of Ca2+ binding events by pcSCP proteins.
Kinetic Measurements • Individual aliquots of pcSCP variants were diluted in a buffer containing EGTA. This compound selectively binds Ca2+ ions, allowing precise control over the concentration of Ca2+ available. • The fluorescence profile of each sample was determined by measuring fluorescent emission from 303 to 400 nm. After obtaining each fluorescence spectrum, a small aliquot of Ca2+ was added to the solution, and another measurement taken. • Fifteen measurements spanning the range from 10-11 to 10-5 M Ca2+ were obtained in triplicate for each pcSCP aliquot. • Three protein samples (one of each pcSCP variant) were tested in random order each time the experiment was performed.
Data Processing • All spectra were standardized by subtracting the spectrum of a sample containing no protein. • For curve-fitting and formal statistical analysis, each individual spectrum was integrated, then all spectra obtained using the same aliquot were standardized to be between zero (no Ca2+ bound) and one (Ca2+ saturated). An example of data from a single fluorescence experiment with pcSCP1a. Left, standardized spectra. Right, fully standardized fluorescence.
Data • According to biochemical theory, kinetic data for proteins with multiple sites will form a sigmoidal curve between 0 and 1. The kinetically relevant portion of the graph is the transition between plateaus. • The data collected in these experiments was highly reproducible, but tended not to form plateaus. This is likely caused by structural changes unrelated to Ca2+-binding. All data, shown in standardized form. Points connected by a line were obtained from the same sample.
Initial Data Exploration • Two formal inference procedures were used to compare the kinetic behavior of pcSCP variants: a Mack-Skillings test and a GLM, both blocking for concentration. • Sensitivity analysis indicated that it was impossible to focus on kinetically relevant information when using the full data set, due to the overwhelming proportion of kinetically irrelevant information in the plateau regions. For formal inferences for block design procedures, only the most kinetically viable observations (all except the first four and the last three data points) were included in the dataset. • An Anderson-Darling test for normality confirmed the normality of the data (AD = 0.5925, p-value = 0.1177).
Formal Statistical Inference Results • Mack-Skillings and GLM procedures both indicated significant differences between pcSCP variants (MS = 13.95, p-value = 0.0009; F = 12.584, p < 0.001, respectively). • Multiple comparisons procedures for Mack-Skillings, which emphasizes consistency of comparisons over magnitude, determined pcSCP1a to be significantly different from both pcSCP1b and pcSCP1c (both p-values < 0.05). • Multiple comparisons procedures for the GLM, which emphasizes magnitude of comparisons over consistency, concluded that pcSCP1c was significantly different from both other variants (both p-values ≤ 0.0049). • These results indicate differences between the pcSCP variants. However, these analyses are not satisfying, primarily because they did not take into account the relationship between concentration and fluorescence.
Dose-Response Curve Fitting • To account for Ca2+ concentration, dose-response curve fitting was employed. This is the most common approach used by biochemists studying protein kinetics. • Curve fitting allows for the computation and comparison of kinetic parameters. The parameters of interest for comparing the pcSCP variants in this study were: • The dissociation constant, KD, a measure of attraction between protein and ligand (in this case Ca2+). • Cooperativity, or interactions between binding sites which alters the KD of one site depending on whether a ligand is bound at another.
Applying the Log-Logistic Model • The standardized fluorescent data were fit to the widely applied log-logistic model: • In this model, c is the bottom plateau; d is the top plateau; b is a measure of cooperativity; and e is the KD (the halfway point between plateaus). • This equation was simultaneously fit to the data for each variant using the drc package in R. This program uses least squares to obtain initial values of b and e, using the transformation • To control for the aberrant behavior seen at high and low concentrations of calcium, values of c and d were held at 0 and 1, respectively.
Curve Fitting Results FONT SIZE IS AN ISSUE IN THIS GRAPH, WOULD IT BE POSSIBLE TO REMAKE IT IN EXCEL? • Fitted log-logistic models for pcSCP variants.
Kinetic Parameter Estimation For all variant comparisons, selectivity indices indicated significant differences (all 3 p-values ≤ 0.0002) between KD parameters. Values of b were significantly different when comparing pcSCP1a to pcSCP1b and when comparing pcSCP1a to pcSCP1c (both p-values ≤ 0.0008). • *95% confidence intervals
Issues with Curve Fitting • Lack-of-fit tests were significant, implying that the log-logistic model does not provide a good fit (F = 18.203, p-value < 0.001). • The residual plot (right) reveals a systematic linear pattern, indicating departures from the model assumptions. • The non-kinetic trends in the tails are likely responsible for part of this lack of fit, but these results are, overall, unsatisfying.
Multivariate Analysis Approach • The unsatisfactory results of curve-fitting as well as concerns about losing information due to excessive standardization of the data led to the employment of multivariate techniques. This is a novel approach for studies of protein kinetics. • The program Pirouette® (Infometrix, Inc.) was used to perform multivariate exploratory and classification methods. • The standardized spectra were used for both techniques. Prior to analysis, these spectra were pre-processed with a 15-point smooth, area normalization, and mean-centering.
Principal Components Analysis • Principal components analysis was used as a method of exploratory analysis. • This technique finds linear combinations of variables which account for the maximal amounts of variation, and plots the data using the first three principal components. • This reduces the dimensionality of the data, allows the display of intersample relationships to be optimized, and can reveal natural clustering patterns.
PCA Scores Plots • Two views of the PCA scores reveal clustering of the data along different factors by variant. Each point represents a single fluorescence spectrum: Pink, pcSCP1a; Blue, pcSCP1b; Orange, pcSCP1c. • Factor 1, 94.7% of the variability in standardized spectra; Factor 2, 2.62%; Factor 3, 0.856%.
Impact of Ca2+ Concentration • Low Ca2+ • Intermediate Ca2+ • High Ca2+ PCA scores plots show separation by free calcium concentration. This confirms that fluorescence spectroscopy is measuring a response by pcSCP to increasing Ca2+. Solid points represent spectra taken at the corresponding level of Ca2+.
Classification Analyses • Two classification techniques were used to analyze these data, k nearest neighbors, and soft independent modeling of class analogy. • These techniques are based on the idea that the closer samples lie in a measurement space, the more likely they are to be in the same category. • KNN classifies an unknown by computing its Euclidean distance to all categorized samples and polling the classes of the k closest samples, while SIMCA develops principal components models for each category and assesses fit of an unknown projected into the space of each model to determine its classification. • These analyses provide a quantitative comparison of the variants by determining how precisely their classifications can be distinguished.
Classification Results KNN • Only 0.04% of samples were misclassified using KNN (K = 7, the optimal value). • Only 0.03% of samples were misclassified using SIMCA (3 factors for each variant). • For all misclassified samples, the second choice was correct. • This ability to separately identify pcSCP variants’ fluorescence spectra confirms they are different. SIMCA
Conclusions • The analyses presented here provide the first indication of significant differences between pcSCP variants. • Multivariate analyses provided the most complete and valid comparison of pcSCP variants. This novel approach is promising as a broadly applicable tool for the comparative analysis of protein kinetics, and its application should be further examined. • The dose-response curve fitting presented here provides a start towards specific kinetic parameter estimation and inference. • Currently, mutants of pcSCP have been generated and their kinetics are being characterized, in order to pinpoint variations responsible for differences in biochemical properties.