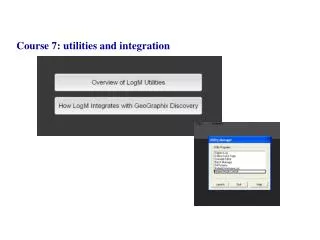
LogM Integration and Utilities Tool
450 likes | 573 Views
Digitize log programs, define curve types, and edit wavelet amplitude, frequency, and phase separately with LogM integration & utilities tool. Switch between project modes, manage batch processes, and create custom patterns easily. Explore waveform influences and enhance seismic data analysis for oil drilling locations.

LogM Integration and Utilities Tool
E N D
Presentation Transcript
Wavelet Editor amplitude freq and phase can be edited separately save reference points wihcu
Selecting the required omponend icon allows you to do the editing
Rebuild work area list: creates a new work area .lst file usually created auto when well is imported
Project mode control: probably will not use since no standalone keys
Switch to project mode: DC Utilities > Project Mode Control (from the drop down list) > Launch Yes to switch
Select buld transfer collowed by > from Discovery to logM workspace
File > Bulk transfer > fr0m Log M Workspace Trnasferred into discovery workspace and associated with UWI and API logs velocity etc can be transferred back to Discovery
On cross section window select well-to well Click on wells then click in blan area to initiate the model builder
Use to immediately generate 2d trace models in the model builder
Top of the madison group with many wells note producing wells in highs and lows Need stratigraphic modeling
Madison and Torquay horizons picked in seisvision are displayed in the logM Well editor
Note the mismatch using logm time alignment, stretch squeeze we can do much better Synthetic is giving a much stronger peak in the Bakken Wavelet phase and freq must match that in the data. We will use the wavelet extraction shaping filter to obtain a much better match
Original synthetic Use fluid substitution model
Note the presence of slight peak in the synthetic with oil as the pore fluid Next we will examine the influence of water versions of the sonic and density with the extracted wavelet. Note that this peak disappears.
Now wel will attempt to quant results with 2D strat modeling
water oil water
We will thicken the oil sand. Launch the middle well in the logm well editor We will use the multicurve stretch squeeze function to thicken the Bakken sand by about 5 meters
We can now conclude that both oil (rather than water in the zone) and thickening of the oil zone produce increased amplitude
Save back to cross section > auto updated > now out of sync> RMB on traces > regenerate traces
Use view model in seisvision we can have the trace model show up in a second vertical trace window
We can use the create correlation polygon option from the pop-up menu to overlay the thickened Bakken sand on other various locations on our seismic to attempt to discover other prospective drilling locations
Notice the southwest to northeast thickening of the Madison to Torquay interval > open arbitrary line
Shows the peak of the Bakken sand over it’s extend across the field >2D models > high am best oil targets