Download

1 / 16
160 likes | 179 Views
Physics of Identified Hadron Spectrum. From identified single particle spectra, Hydro-dynamical collective expansion velocity ( b) . Thermal freeze-out temperature (T th ). Chemical freeze-out temperature and chemical potential ( T ch , m B , m s )

E N D
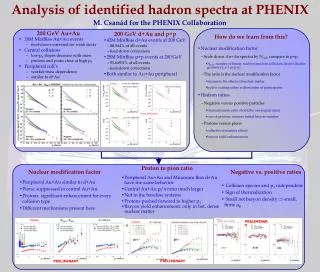
Physics of Identified Hadron Spectrum • From identified single particle spectra, • Hydro-dynamical collective expansion velocity (b). • Thermal freeze-out temperature (Tth). • Chemical freeze-out temperature and • chemical potential (Tch, mB, ms) • Jet quenching effect at high pT by parton • energy loss in medium (dE/dx). Inverse slope dN/dy High pT spectra Shed light on QGP formation at RHIC In this talk, we present identified (charged) single particle spectra as a function of centrality, measured at RHIC-PHENIX.
PHENIX Detector Setup In this analysis, we use • Beam-Beam Counter (BBC) • z-vertex, start timing for TOF • Time-of-Flight (TOF) • stop timing measurement • Drift Chamber (Dch) • momentum, flight path length • Pad Chamber 1 (PC1) • additional track z-information to Dch
TOF - TOFexpected * Fitted p+ region Particle Identification by TOF • Demonstrated Clear PID by TOF • Time-of-Flight resolution • sTOF ~ 110-120 ps
p+ P K+ Charge * Momentum [GeV/c] p p- K- m2 [(GeV/c2)2] PID Cut Criteria p+ (a.u.) All momentum w/o PID cut K+ Proton m2 [(GeV/c2)2] • PID by m2 vs. momentum space • |m2measured - m20| < 2.5sm2 • Momentum cutoff • p : 0.1 < p < 2.0 GeV/c • K : 0.2 < p < 2.0 GeV/c • p/pbar : 0.2 < p < 4.0 GeV/c
Correction factor for raw spectra • Based on single particle Monte Carlo simulation. • Included overall effects • Tracking efficiency • Geometrical acceptance • Multiple scattering • Decay in flight • Hadronic int. • Dead area of detectors • Confirmed that the multiplicity dep. is small by track embedding method in real data. positive p negative Pt [GeV/c] K Pt [GeV/c] p 0.0 0.5 1.0 1.5 2.0 2.5 3.0 3.5 4.0 Pt [GeV/c]
Centrality Classes • Used correlation between BBC charge • and ZDC energy to define centrality. • Extracted Npart based on Glauber model Dch raw multiplicity distributions
(a.u.) PHENIX Preliminary Results : Minimum bias pT spectra • pions yield ~ proton and pbar yield • @ pT~ 2 GeV/c Large proton and anti-proton contributions at high pT.
(a.u.) PHENIX Preliminary p (X 10-1) (X 10-1) Minimum bias MT spectra • In 0.2 < mt – m0 < 1.2 [GeV/c2], spectra for • all species scale by single exp. function. • Similar inverse slope for p and K. • Tproton > Tp Fitting results by single exp. function p ~ 2055 (stat.) 15 (sys.) MeV K ~ 2155 (stat.) 20 (sys.) MeV p, ~ 32010 (stat.) 20 (sys.) MeV
PHENIX Preliminary PHENIX Preliminary (a.u.) (a.u.) p+ p- 0-5 % 5-15% 15-30% 30-60% 60-80% Centrality Dependence of MT Spectra for pions • Single exponential scaling at 0.2 -1.0 GeV in mt-m0. • Almost parallel among all centrality classes. • Tp (central 0-5%) ~ 210 MeV 5 (stat.) 15 (sys.) MeV
PHENIX Preliminary PHENIX Preliminary (a.u.) (a.u.) K- K+ 0-5 % 5-15% 15-30% 30-60% Centrality Dependence of MT Spectra for kaons • Single exponential scaling at 0.2 -1.0 GeV in mt-m0. • Parallel slope among all centrality classes. • TK (central 0-5%) ~ 217 MeV 5 (stat.) 20 (sys.) MeV. • Tp
PHENIX Preliminary (a.u.) proton 0-5 % 5-15% 15-30% 30-60% 60-80% p Centrality Dependence of MT Spectra for p/pbar PHENIX Preliminary (a.u.) • Single exponential scaling at 0.2 -1.2 GeV in mt-m0. • Gradual increase from centrality 60-80% to 30-60%. • Tproton (central 0-5%) ~ 325 MeV 17 (stat.) 20 (sys.) MeV > Tp.
PHENIX Preliminary Centrality dependence of T • Weak centrality dependence for Tp and TK. • Gradual rise of Tproton and Tpbar from • peripheral to mid-central collisions. • TpTK < Tproton
PHENIX Preliminary Mass Dependence of T Intuitive explanation of mass dependence of T bt : Transverse expansion velocity
Comparison with CERN Energy PHENIX Preliminary • The slopes of pions and protons at RHIC are • higher than that of Pb+Pb collisions at SPS. • Kaon’s slope is almost same at SPS Pb+Pb. SPS data : NA44 (most central)
Conclusions • Single particle spectra for p , K , protons and anti-protons in each centrality class are studied. • In pT spectra, a large proton and anti-proton contributions at high pT. • Weak centrality dependence of slopes for Tp and TK. • Gradual rise of Tproton and Tpbar from peripheral to mid-central collisions. • TpTK < Tproton at all centrality classes. • The slope of pions and protons at RHIC are higher than that of Pb+Pb collisions at SPS. • Kaon’s slope at RHIC is almost same at SPS Pb+Pb.