Download
1 / 40
400 likes | 664 Views
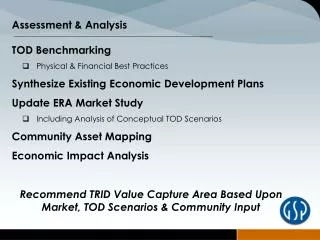
Benchmarking the Value of Best Practices. CPI Conference September 30, 2002 Austin, Texas. Session Participants. Moderator John Tato - U.S. Department of State Panelists Jack Yarbrough – Jacobs Steve Thomas - CII. Goals of this Session.

E N D
Benchmarking the Value of Best Practices CPI Conference September 30, 2002 Austin, Texas
Session Participants Moderator • John Tato - U.S. Department of State Panelists • Jack Yarbrough – Jacobs • Steve Thomas - CII
Goals of this Session • Highlight recent Benchmarking & Metrics Program improvements • Present key findings from the program • Illustrate the value of benchmarking • Address barriers to benchmarking
NO 26% YES 74% Q: Are you currently benchmarking your projects? Reasons for notbenchmarking: • Lack of time and other resources. • Project management reporting process not formally established.
NO YES 50% 50% Q: Do you have a data collection infrastructure that facilitates the collection of data essential to an effective benchmarking system? Reason for “No” responses: • No in-house system
NR NA YES/NO 7% 2% YES 4% 30% NO 57% Q: Are you satisfied with your benchmarking program? Reasons for “No” responses: • No program has been implemented • More consistency/standardization needed in • benchmarking projects • Benchmarking efforts need to be focused on other types of projects • Data systems should be more flexible/automated
Our Charter • Establish common definitions. • Establish metric norms. • Determine value of best practices. • Provide members a basis for self-analysis. • Support CII research and implementation activities through feedback.
Our Customers • Member Companies • Research and Implementation • Funded Studies • Alliances • Benchmarking Participants Program (BMPP)
Owner Aramco Services Company Contractor S&B Engineers and Constructors Ltd. Watkins Engineers & Constructors Inc. Benchmarking User Award
Questionnaire Development Version 1 • Cost Performance • Schedule Performance • Safety Performance • Change Performance • Rework Performance Performance Metrics Version 1 Best Practices Metrics • Pre-Project Planning • Constructability • Team Building • Zero Accident Techniques First version $ 11.47 Billion 209 Projects
Questionnaire Development Version 2 • Cost Performance • Schedule Performance • Safety Performance • Change Performance • Rework Performance Performance Metrics Version 2 Best Practices Metrics • Pre-Project Planning • Constructability • Team Building • Zero Accident Techniques • Project Change Mgmt • Design/Info. Tech. Refinements Addition of Two practices 442 Projects (Cumulative) $ 25.95 Billion (Cumulative)
Questionnaire Development Version 3 • Cost Performance • Schedule Performance • Safety Performance • Change Performance • Rework Performance Performance Metrics Version 3 Best Practices Metrics • Pre-Project Planning • Constructability • Team Building • Zero Accident Techniques • Project Change Mgmt • Design/Info. Tech. PDRI For Buildings (part of Pre-Project Planning) 745 Projects (Cumulative) $ 39.88 Billion (Cumulative)
Questionnaire Development Version 4 • Cost Performance • Schedule Performance • Safety Performance • Change Performance • Rework Performance Performance Metrics Version 4 Best Practices Metrics • Pre-Project Planning • Constructability • Team Building • Zero Accident Techniques • Project Change Mgmt • Design/Info. Tech. Electronic/Web Questionnaire 906 Projects (Cumulative) $ 49.68 Billion (Cumulative)
988 Projects (Cumulative) $ 52.15 Billion (Cumulative) Questionnaire Development Version 5 • Cost Performance • Schedule Performance • Safety Performance • Change Performance • Rework Performance Performance Metrics Version 5 Best Practices Metrics • Pre-Project Planning • Constructability • Team Building • Zero Accident Techniques • Project Change Mgmt • Design/Info. Tech. • Materials Management • Planning for Startup Entire PDRI - (part of Pre-Project Planning) Materials Management Planning for Startup
Questionnaire Development Version 6 • Cost Performance • Schedule Performance • Safety Performance • Change Performance • Rework Performance • Construction • Productivity Metrics Performance Metrics Version 6 Best Practices Metrics • Pre-Project Planning • Constructability • Team Building • Zero Accident Techniques • Project Change Mgmt • Design/Info. Tech. • Materials Management • Planning for Startup • Quality Management Project Environment Quality Management Construction Productivity Metrics 1037 Projects (Cumulative) $ 54.19 Billion (Cumulative)
Questionnaire Development Version 7 • Cost Performance • Schedule Performance • Safety Performance • Change Performance • Rework Performance • Construction • Productivity Metrics Performance Metrics Version 7 Best Practices Metrics • Pre-Project Planning • Constructability • Team Building • Zero Accident Techniques • Project Change Mgmt • Technology Auto. / Integ. • Materials Management • Planning for Startup • Quality Management Major Upgrade !!! 100% Review/Rewrite & 32% Reduction in Basic Questionnaire 1057 Projects (Cumulative) $ 56 Billion (Cumulative)
BM&M Questionnaire Customers • Member Companies • Research & Implementation • Funded Studies • Alliances • BMPP Questionnaire Metrics • Cost & Schedule • Safety • Best Practices • Environment • Data • Productivity • Construction • Engineering
October 25-26, 2001 December 11-12, 2001 January 17-18, 2002 Diagnose Data Analysis & 1st Revision Workshop 2nd Revision Workshop February 5, 2002 March 4, 2002 March 4 – April 30, 2002 Power User Workshop Analysis/Value of Best Practices Workshop Final Revisions & Reprogramming Questionnaire Streamlining Process
May 9, 2002 Release of Version 7 Questionnaire Streamlining Process
Process of Determining Value of Best Practices Determine Practice to BM Revise Practice Use Questions or Drop Practice Failed Perform Preliminary Analysis (Correlation) Survey Practice Use & Performance Add Practice to BM&M Questionnaire Preliminary Assessment Passed 1. Recommended Status as BP 2. Value of BP Perform Comprehensive Analysis Report Output Continue Data Collection
Cost Savings $10.9MM – Cost of average building project x 8.5% – Cost growth savings $926K – Potential savings for typical project
Schedule Reductions 28 Month – Total duration of average building project x 31.7% – Schedule growth savings 8 Month – Potential savings for typical project
Project Budget Factor= Actual Total Project Cost (Initial Predicted Project Cost + Approved Changes)
Project Outcome 0.10 0.05 0.00 Project Cost Growth -0.05 Δ Opportunity -0.10 -0.15 Time -0.20 Ver 1 1996 Ver 2 1997 Ver 3 1998 Ver 4 1999 Ver 5 2000 Ver 6 2001 CII Average Practice Use Questionnaire Version and Year CII 1st Quartile Practice Use Gap Analysis
Best Practices Owner Contractor Bldg. H.I. Infra. L.I. Bldg. H.I. Infra. L.I. Pre Project Planning High High Low High Low Med High Low Constructability Med Med Med High High Med Low High Change Mgmt High High High Low Low High Low Low Design / Info Technology Low Low Low Low Low Med Low Low Team Building Low Med Low Med Med Med Med Med Low Zero Accident Techniques Low Low Low Low High Med Low Comprehensive AssessmentImpact on Cost Performance The Effects of Best Practice Use by Industry Sector – Project Cost Impact
Best Practices Owner Contractor Bldg. H.I. Infra. L.I. Bldg. H.I. Infra. L.I. Pre Project Planning Low Med High Med Low Med Med Low Constructability Low High Low High Low Low Med Med Change Mgmt Low Low High Low Med Med Low Low Design / Info Technology High Med Low Med High Med Low High Team Building Low Low Med Low Med High Low Low Med Zero Accident Techniques High Low Low Low Low High Low Comprehensive AssessmentImpact on Schedule Performance The Effects of Best Practice Use by Industry Sector – Project Schedule Impact
The Results Safety PerformanceOwners & Contractors 16 14.30 14.20 13.00 13.10 14 12.20 11.80 Industry 12 10.60 9.90 9.50 8.30 10 8.80 8.60 Est. 7.28 Recordable Incidence Rate 7.19 8 6.12 5.32 6 CII 4.31 3.44 4 3.00 2.66 2.30 1.03 1.67 1.60 1.59 2 1.02 0 2001 1989 1990 1991 1992 1993 1994 1995 1996 1997 1998 1999 2000 1,115 325 413 477 497 527 613 644 770 518 765 995 936 Year and Work-hours (MM) Note: Industry based on OSHA SIC 15-17
Benchmarking • Is critical to continuous improvement process. • Requires senior management commitment. • Requires continual analysis and assessment. • Requires a structured approach. • Is not resource-intensive. • Is available now. • Is important to the “bottom-line.”
Get Involved Measure Your Performance • Attend a Benchmarking training session to get your password to Project Central – CII Benchmarking’s website • Add your project data to Project Central at http://cii-benchmarking.org Assess • Evaluate your performance • Determine the gap Improve • Use the Benchmarking and CII tools to improve