11.2 Exponential Functions
11.2 Exponential Functions . By the end of the sections students will graph exponential functions using properties of exponents and parent graph transformations, solve problems involving exponential growth and decay. Students will demonstrate this by creating a collaborative poster.

11.2 Exponential Functions
E N D
Presentation Transcript
11.2 Exponential Functions By the end of the sections students will graph exponential functions using properties of exponents and parent graph transformations, solve problems involving exponential growth and decay. Students will demonstrate this by creating a collaborative poster.
By the end of the sections students will graph exponential functions using properties of exponents and parent graph transformations, solve problems involving exponential growth and decay. Students will demonstrate this by creating a collaborative poster. Recall: Laws of Exponents • Product Property • Quotient Property • Power of a Power • Power of a Product • Power of a Quotient Parent Graph Transformations • Reflections • x-axis: • y-axis: • Translations • Vertical: • Horizontal: • Dilations • Vertical: • Horizontal: • Your “X” lies to you!
By the end of the sections students will graph exponential functions using properties of exponents and parent graph transformations, solve problems involving exponential growth and decay. Students will demonstrate this by creating a collaborative poster. Legend of PaalPaysam • The legend goes that the tradition of serving PaalPaysam to visiting pilgrims started after a game of chess between the local king and the lord Krishna himself. The king was a big chess enthusiast and had the habit of challenging wise visitors to a game of chess. One day a traveling sage was challenged by the king. To motivate his opponent the king offered any reward that the sage could name. The sage modestly asked just for a few grains of rice in the following manner: the king was to put a single grain of rice on the first chess square and double it on every consequent one. • Having lost the game and being a man of his word the king ordered a bag of rice to be brought to the chess board. Then he started placing rice grains according to the arrangement: 1 grain on the first square, 2 on the second, 4 on the third, 8 on the fourth and so on: • Following the exponential growth of the rice payment the king quickly realized that he was unable to fulfill his promise because on the twentieth square the king would have had to put 1,000,000 grains of rice. On the fortieth square the king would have had to put 1,000,000,000 grains of rice. And, finally on the sixty fourth square the king would have had to put more than 18,000,000,000,000,000,000 grains of rice which is equal to about 210 billion tons and is allegedly sufficient to cover the whole territory of India with a meter thick layer of rice. At ten grains of rice per square inch, the above amount requires rice fields covering twice the surface area of the Earth, oceans included. • It was at that point that the lord Krishna revealed his true identity to the king and told him that he doesn't have to pay the debt immediately but can do so over time. That is why to this day visiting pilgrims are still feasting on PaalPaysam and the king's debt to lord Krishna is still being repaid.
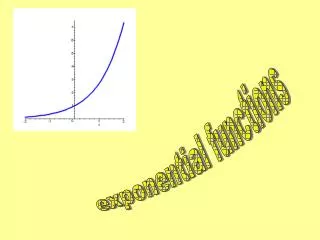
By the end of the sections students will graph exponential functions using properties of exponents and parent graph transformations, solve problems involving exponential growth and decay. Students will demonstrate this by creating a collaborative poster. Graphing Exponential Functions • After hearing the story we can see that choosing “good” x-values when graphing is very important, otherwise we can end up with VERY large numbers. • Keep in mind some rules: • What happens to a number when you multiply by a positive number larger than 1? • Original number gets bigger (growth) • What happens to a number when you multiply by a positive number smaller than 1? • Original number gets smaller (decay) • What happens when you multiply a number by a negative number (repeatedly?) • Sign of the number changes: -, +, -, +, -, + …
By the end of the sections students will graph exponential functions using properties of exponents and parent graph transformations, solve problems involving exponential growth and decay. Students will demonstrate this by creating a collaborative poster. Example 1: Complete the table and Graph the Exponential Function Note: what are some “easy” exponents? -2, -1, 0, 1, 2
By the end of the sections students will graph exponential functions using properties of exponents and parent graph transformations, solve problems involving exponential growth and decay. Students will demonstrate this by creating a collaborative poster. Example 1: Complete the table and Graph the Exponential Function
By the end of the sections students will graph exponential functions using properties of exponents and parent graph transformations, solve problems involving exponential growth and decay. Students will demonstrate this by creating a collaborative poster. Example 1: Complete the table and Graph the Exponential Function Does this graph make sense? We said that if you multiply by a number larger than 1, your original number gets bigger?
By the end of the sections students will graph exponential functions using properties of exponents and parent graph transformations, solve problems involving exponential growth and decay. Students will demonstrate this by creating a collaborative poster. Example 1: Complete the table and Graph the Exponential Function • What might this graph look like? • What if we choose values of x like ? • When we deal with Exponential Functions , we restrict our values of to positive real numbers
By the end of the sections students will graph exponential functions using properties of exponents and parent graph transformations, solve problems involving exponential growth and decay. Students will demonstrate this by creating a collaborative poster. Example 1: Complete the table and Graph the Exponential Function • Why is this problem ok, but the last one is not? • What happens to a function when we put a negative in the front? • e.g. and
By the end of the sections students will graph exponential functions using properties of exponents and parent graph transformations, solve problems involving exponential growth and decay. Students will demonstrate this by creating a collaborative poster. Example 2: Describe the changes from the parent function. Sketch each function • Vertical translation DOWN 2 units • Horizontal COMPRESSION by a factor of ½ • Reflection over the x-axis, • vertical EXPANSION by a factor of 2 • Reflection over the y-axis
By the end of the sections students will graph exponential functions using properties of exponents and parent graph transformations, solve problems involving exponential growth and decay. Students will demonstrate this by creating a collaborative poster. Example 2: Describe the changes from the parent function. Sketch each function B. • Horizontal translation 3 units RIGHT • Vertical translation 3 units DOWN • Reflection over the x-axis • Vertical translation 3 units UP
By the end of the sections students will graph exponential functions using properties of exponents and parent graph transformations, solve problems involving exponential growth and decay. Students will demonstrate this by creating a collaborative poster. Exponential Growth or Decay Usually applied to POPULATIONS , can also be seen as Since t is the input (variable) This formula is modified for money to look like Where A= final amount, P=Principal (initial) investment, n=number of times interest is paid.
By the end of the sections students will graph exponential functions using properties of exponents and parent graph transformations, solve problems involving exponential growth and decay. Students will demonstrate this by creating a collaborative poster. Example 3: Find each of the following populations in calculator ready form. If you have a calculator, find the exact amount. • In 1985, there were 65 cell phone subscribers in the small town of Southwestville. The number of subscribers increased by 7.5% per year after 1985. How many cell phone subscribers were in Southwestvillein 1994? (Don't consider a fractional part of a person.)
By the end of the sections students will graph exponential functions using properties of exponents and parent graph transformations, solve problems involving exponential growth and decay. Students will demonstrate this by creating a collaborative poster. Example 3: Find each of the following populations in calculator ready form. If you have a calculator, find the exact amount. B. Each year the local country club sponsors a tennis tournament. Play starts with 128 participants. During each round, half of the players are eliminated. How many players remain after 5 rounds?
By the end of the sections students will graph exponential functions using properties of exponents and parent graph transformations, solve problems involving exponential growth and decay. Students will demonstrate this by creating a collaborative poster. Example 3: Find each of the following populations in calculator ready form. If you have a calculator, find the exact amount. C. The population of penguins has a population of 500 at the beginning of the month. The penguins have been told of a surf competition elsewhere in the world and have been leaving their colony at a rate of 8% per week. How many penguins remain after 7 weeks? penguins remain
By the end of the sections students will graph exponential functions using properties of exponents and parent graph transformations, solve problems involving exponential growth and decay. Students will demonstrate this by creating a collaborative poster. Mad Lib Example (stolen from grau) • Choose each of the following: • Name of a person • Object • Number between 0 and 100 • Any positive whole number • Number between 0 and 12 • Number between 0 and 100 • Some positive whole number larger than d. • Number between 0 and 12
By the end of the sections students will graph exponential functions using properties of exponents and parent graph transformations, solve problems involving exponential growth and decay. Students will demonstrate this by creating a collaborative poster. Example 3: Find each of the following populations in calculator ready form. If you have a calculator, find the exact amount. D. has a collection of ’s. They collect them at a rate of per month. If their collection started with . How many items will be in their collection at the end of months?
By the end of the sections students will graph exponential functions using properties of exponents and parent graph transformations, solve problems involving exponential growth and decay. Students will demonstrate this by creating a collaborative poster. Example 3: Find each of the following populations in calculator ready form. If you have a calculator, find the exact amount. E. decided that is it weird to collect ’s. They decide to sell them at a rate of per month. If their collection ended with . How many items will be in their collection at the end of months?
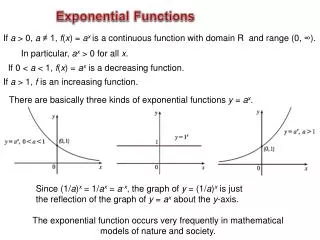
By the end of the sections students will graph exponential functions using properties of exponents and parent graph transformations, solve problems involving exponential growth and decay. Students will demonstrate this by creating a collaborative poster. Summary Match each of the equations to their possible graph. B. A. C. D. • 5. The population of Lodi is 12,500 increasing at a rate of 9% per year. What will the projected population be in 5 years?
By the end of the sections students will graph exponential functions using properties of exponents and parent graph transformations, solve problems involving exponential growth and decay. Students will demonstrate this by creating a collaborative poster. Summary (solutions) Match each of the equations to their possible graph. 2. 4. 3. 1. • 5. The population of Lodi is 12,500 increasing at a rate of 9% per year. What will the projected population be in 5 years?