Download
1 / 21
210 likes | 232 Views
This chapter explores the use of graphs to describe and analyze motion, including speed, velocity, distance, position, displacement, and time. It covers topics such as average versus instantaneous speed, interpreting distance versus time graphs, slope, positive and negative velocities, velocity equations, velocity versus time graphs, and constant velocity.

E N D
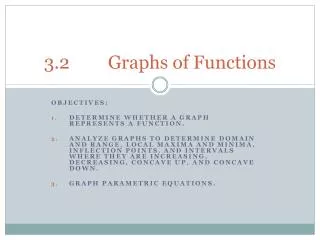
Chapter Objectives • Calculate time, distance, or speed when given two of the three values. • Solve an equation for any of its variables. • Use and interpret positive and negative values for velocity and position. • Describe the relationship between three-dimensional and one-dimensional systems. • Draw and interpret graphs of experimental data, including velocity versus position, and speed versus time. • Use a graphical model to make predictions that can be tested by experiments. • Derive an algebraic model from a graphical model and vice versa. • Determine velocity from the slope of a position versus time graph. • Determine distance from the area under a velocity versus time graph.
average speed constant speed coordinates coordinate system displacement instantaneous speed instantaneous velocity origin position rate slope time vector velocity Chapter Vocabulary
Inv 3.2 Position, Velocity, and Time Graphs Investigation Key Question: How are graphs used to describe motion?
3.2 Graphs of Speed and Velocity • There are many graphs involving the terms speed, velocity, distance, position, displacement and time. • A position versus time graph shows the details of the actual motion during the trip.
3.2 Average vs. instantaneous speed • Average speed is the total distance traveled divided by the total time taken. • Instantaneous speed is the apparent speed at any moment, such as on a speedometer.
Interpreting a distance versustime graph This distance versus time graph shows a boat traveling through a long canal. The boat has to stop at locks for changes in water level. • How many stops does it make? • What is the boat’s average speed for the whole trip? • What is the highest speed the boat reaches?
Interpreting a distance versustime graph • The boat makes three stops because there are three horizontal sections on the graph. • The average speed is 10 km/h (100 km ÷ 10 h). • The highest speed is 20 km/h. The position changes by 20 km in one hour for the first, third, and fifth hours of the trip.
3.2 Slope The slopeof a line is the ratio of the “rise” (vertical change) to the “run”(horizontal change) of the line.
3.2 Positive and negative velocities • When the direction of motion is part of the calculation, changes in position are referred to as displacement.
3.2 Positive and negative velocities • Average velocity uses the values of displacement and elapsed time from the position vs. time graph. • The average velocity at C is 12 mph.
3.2 Positive and negative velocities • The slope of the position vs. time graph at any one time is called instantaneous velocity.
Velocity (v) is calculated by dividing the change in position (Δx) by the change in time (Δt). 3.2 Velocity Equations
3.2 The velocity versus time graph • The velocity versus time graph has velocity on the y-axis and time on the x-axis. • On this graph, a constant velocity is a straight horizontal line. • Information about an object’s position is also present in the velocity versus time graph.
3.3 Constant Velocity • This graph shows that the velocity: • is 1 m/s. • stays constant at 1 m/s for 10 seconds.
3.2 The velocity vs. time graph • The area on a velocity versus time graph is equal to the distance traveled.
A velocity versus time graph can show positive and negative velocities. 3.2 Relating v vs. t
The position versus time graph, can yield the same information using the slope to calculate velocity at corresponding time intervals. 3.2 Relating x vs. t