Download
1 / 55
550 likes | 570 Views
Investigating if individuals aged 20 and 40 have different systolic blood pressure levels through independent samples t-test with statistical evidence and hypothesis testing.

E N D
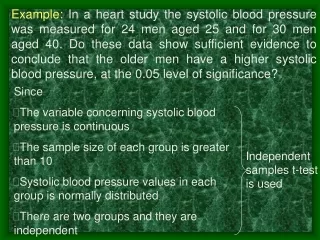
Example: In a heart study the systolic blood pressure was measured for 24 men aged 25 and for 30 men aged 40. Do these data show sufficient evidence to conclude that the older men have a higher systolic blood pressure, at the 0.05 level of significance? • Since • The variable concerning systolic blood pressure is continuous • The sample size of each group is greater than 10 • Systolic blood pressure values in each group is normally distributed • There are two groups and they are independent Independent samples t-test is used
GROUP N Mean Std. Deviation 20- year-old 24 122,8333 16,7790 40- year-old 30 133,6667 17,3013 160 150 140 Mean 1 SD SBP 130 120 110 100 N = 24 30 20- year-old 40- year-old GROUP
(1) H0:1=2 Ha: 1<2 (2) Testing the equality of variances H0:21= 22 Ha: 21 22 Accept H0. Variances are equal.
t(52,0.05)=1.65< p<0.05, Reject H0. (4) (5) The older men have higher systolic blood pressure (3)
Example: NK cell activity was measured for three groups of subjects: those who had low, medium, and high scores on Social Readjustment Rating Scale. The original observations, sample sizes, means and standard deviations are given in table. Is the mean NK cell activity different in three groups?
The variable concerning NK cell activity measures is continuous. • There are three groups. • Variances are equal in three groups. • NK cell activity values in each group are normally distributed. • The sample size of each group is greater than 10 One-Way ANOVA
60 50 40 30 Mean 1 SD NKA 20 10 0 N = 13 12 12 Low Moderate High GROUP
H0: 1= 2=3 Ha: Not all the i are equal. SSA=SST-SSW=7182.31-3394.01=3788.30
MSW=SSW/34=3394.01/27=99.82 MSA=SSA/(3-1)=3788.30/2=1894.15 F=MSA/MSW=1894.15/99.82=18.98 We conclude that not all population means are equal.
Hypothesis LSD Statistical Decision H0: 1= 2 22.32>8.12, reject H0. H0: 1= 3 19.87>8.12, reject H0. H0: 2= 3 2.46<8.28, accept H0. Since n1 n2, reject H0 if
Example: A study was conducted to see if a new therapeutic procedure is more effective than the standard treatment in improving the digital dexterity of certain handicapped persons. Twenty-four pairs of twins were used in the study, one of the twins was randomly assigned to receive the new treatment, while the other received the standard therapy. At the end of the experimental period each individual was given a digital dexterity test with scores as follows.
Since • The variable concerning digital dexterity test scores is continuous • The sample size is greater than 10 • digital dexterity test score is normally distributed • There are two groups and they are dependent Paired sample t-test
H0: d = 0 New Standard Difference 49 54 -5 56 42 14 Ha: d> 0 70 63 7 83 77 6 83 83 0 68 51 17 84 82 2 63 54 9 67 62 5 79 71 8 88 82 6 48 50 -2 52 41 11 73 67 6 52 57 -5 73 70 3 78 72 6 64 62 2 71 64 7 42 44 -2 Since, reject H0. 51 44 7 56 42 14 40 35 5 81 73 8 Total 129 Mean 65,46 60,08 5,38 SD 14,38 14,46 5,65 t(23,0.05)=1.7139 We conclude that the new treatment is effective.
Example: We want to know if children in two geographic areas differ with respect to the proportion who are anemic. A sample of one-year-old children seen in a certain group of county health departments during a year was selected from each of the geographic areas composing the departments’ clientele. The followig information regarding anemia was revealed.
Reject H0. We concluded that the proportion of anemia is different in two geographic areas.
Example: A special diet program was given to 20 clinically obese people. Subjects’ BMI were measured before the diet and they have been followed for two months. BMI measures before the diet and after the end of each month following the diet are given in the table. Is the diet program effective?
The variable concerning BMI is continuous • The sample size is greater than 10 • BMI values are normally distributed • There are three groups and they are dependent Repeated measures ANOVA
Sources of variation SS df MS F Sig. Times 16.79 2 8.39 95.92 0.000 Subjects 567.72 19 29.89 Error 3.33 38 0.09 Diet program is effective on obese subjects’ BMI.
Example: To test the median level of energy intake of 2 year old children as 1280 kcal reported in another study, energy intakes of 10 children are calculated.Energy intakes of 10 children are as follows:
Since • The variable concerning energy intake is continuous • The sample size is not greater than 10 • Energy intake is not normally distributed • There is only one group Sign test
H0: The population median is 1280. HA: The population median is not 1280. + - + + - - - - + - Number of (-) signs = 6 and number of (+) signs = 4 For k=4 and n=10 From the sign test table p=0.377
Since p > 0.05 we accept H0 We conclude that the median energy intake level in 2 year old children is 1280 kcal.
Example: Cryosurgery is a commonly used therapy for treatment of cervical intraepithelial neoplasia (CIN). The procedure is associated with pain and uterine cramping. Within 10 min of completing the cryosurgical procedure, the intensity of pain and cramping were assessed on a 100-mm visual analog scale (VAS), in which 0 represent no pain or cramping and 100 represent the most severe pain and cramping. The purpose of study was to compare the perceptions of both pain and cramping in women undergoing the procedure with and without paracervical block.
5 women were selected randomly in each groups and their scores are as follows:
Since • The variable concerning pain/cramping score is continuous • The sample size is less than 10 • There are two groups and they are independent Mann Whitney U test
R1= 1+2+3+4.5+10 = 20.5 From the table, critical value is 21 19.5 < 21 accept H0 We conclude that the median pain/ cramping scores are same in two groups.
CHD Smoking Total + - 10 40 30 Yes 46 4 50 No Total 14 76 90 Example: A study wasconducted to analyze the relation between coronary heart disease (CHD) and cigarette smoking. 40 patients with CHD and 50 control subjects were randomly selected from the records and smoking habits of these subjects were examined. Observed values are as follows:
Cigarette Smoking CHD Total + - 33.8 6.2 10 40 30 Yes 7.8 42.2 46 4 50 No Total 14 76 90 Observed and expected frequencies
df = (r-1)(c-1)=(2-1)(2-1)=1 2(1,0.05)=3.845 reject H0 2=4. 95 > Conclusion: There is a relation between CHD and cigarette smoking.
Example:To test whether the weight-reducing diet is effective 9 persons were selected. These persons stayed on a diet for two months and their weights were measured before and after diet. The following are the weights in kg: • Since • The variable concerning weight is continous. • The sample size is less than 10 • There are two groups and they are dependent Wicoxon signed ranks test
T = 1.5 reject H0, p<0.05 T = 1.5 < T(n=9,a =0.05) = 6 reject H0, p<0.01 T = 1.5 < T(n=9,a =0.01) = 2 We conclude 99% cinfident that diet is effective.
Example: Hamilton depression scores was measured for three groups of subjects and shown in table. Is the Hamilton depression scores different in three groups?
Since • The variable concerning Hamilton depression score is continuous • The sample size is less than 10 • There are three groups and they are independent Kruskal Wallis H0: The population distributions are all identical. Ha: At least one of the populations tends to exhibit larger values than at least one of the other populations.
KW=7.93 > c2(2,a=0.05)= 5.99 Reject H0 We conclude that at least one of the populations tends to exhibit larger values than at least one of the other populations.
Example: To compare the effects on the clotting time of plasma of four different methods of treatment of the plasma. Samples of plasma from 8 subjects were assigned to the four treatments.
Since • The variable concerning clotting time is continuous • The sample size is less than 10 • There are four groups and they are dependent Friedman Test
2(3,0.05)= 7.815 < Fr=14.96, p<0.05 Reject H0. We conclude that at least one of the treatments were different from the other treatments.
Example Measures of lipid content and total energy content of the stools were recorded. Data for the cystic fibrosis children are given in the table. Find and interpret the correlation between stool lipid and stool energy
Correlation between stool lipid and stool energy is 0.42. Is it significant? p=0.06251 There is no significant correlation between stool lipid and stool energy.
Example Intravenous glucose tolerance tests were performed on 14 hyperthyroid women, 6 of whom were overweight, and in 19 volunteers with normal thyroid levels matched for age and weight. Insulin sensitivity and BMI of these women are given in the table. • Find the correlation coefficients between BMI and insulin sensitivity in the control group and hyperthyroid group. • In which group, bmi is more effective? • Find the regression equation for each group?