IDS Project
200 likes | 235 Views
IDS Project. Update on Human Factors and Simulation (Geometry Completed). Human Factors. Analyze problem Task analysis “What are drivers doing wrong?” “Who is at most risk?” Driver model (Information Process) “Why are they doing it wrong?”

IDS Project
E N D
Presentation Transcript
IDS Project Update on Human Factors and Simulation (Geometry Completed)
Human Factors • Analyze problem • Task analysis • “What are drivers doing wrong?” • “Who is at most risk?” • Driver model (Information Process) • “Why are they doing it wrong?” • “What information could support correct behavior?” • Previous solutions • “What has not worked before?” • Simulate case site • Propose interfaces and simulate candidate • Evaluate candidate interface
Task Analysis • Detect intersection • Decelerate and enter correct lane • Signal if intending to turn • Detect and interpret traffic control device • Detect traffic and pedestrians • Detect, perceive, and monitor gaps • Accept gap and complete maneuver • Continue to monitor intersection
Human factors issues • In Minnesota, most drivers stop before proceeding (Preston & Storm, 2003) • 57% stopped in 2296 rural thru-STOP accidents • 87% of right angle crashes at US 52 and CSAH 9 occurred after the driver stopped • Suggests drivers have problem • Detecting gaps • Perceiving gaps • Judging gaps
Information Needs • Vehicle Detection • Convey speed/distance/arrival time • Measure/convey gap • Judge “safe gap”, display location
High Risk • Older drivers (> 65 years) have a high crash risk at intersections • Drivers > 75 years had greatest accident involvement ratio (Stamatiadis et al., 1991) • Drivers > 65 years 3 to 7 times more likely to be in a fatal intersection crash (Preusser et al., 1998) • Drivers > 65 years over-represented in crashes at many rural intersections in Minnesota (Preston & Storm, 2003)
Collision Countermeasure System Prince William Co., Virginia • Thru-STOP at two 2-lane roads • Focus on warning major approach • Data Collected: • Speed (intersection arrival, reduction) • Projected time to collision (PTC)
Human machine interface evaluated forCollision Countermeasure System (CCS)Prince William County, Virginia • Aden road (major) & Fleetwood Drive (minor) intersection located on plateau with restricted sight distances. • Drivers on minor leg often had difficulty sensing safe gap On minor leg On major leg
Collision Countermeasure System (minor approach) (major approach)
Intersection Collision Avoidance Warning System Norridgewock, Maine • Thru-STOP at two 2-lane roads • Focus on warning minor approach • Data: • Observational techniques • Surveys
Limited Sight Distance Warning Signs Gwinnett County, Georgia • 18 Thru-STOPs at two 2-lane roads • Chosen based on minimum sight distance guidelines & reported problems • Warnings for major &/or minor approaches • Signs considered interim solution
Relevant ITS Concept- COMPANION • Two 2-lane, One 3-lane highway • Variable flashing modes depending on hazard
COMPANION • Manually activated (for study) • Simulated truck break-down • Results: • Reduction in speed • Harmonization of speed over lanes • Reduction in all types of crashes • Greater effects for drivers in slow lanes
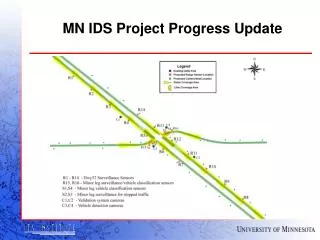
Simulation • Construction Data (TH52 and CSAH9) • Road geometry • Elevation profile • Ditch Profile • Digital Elevation Model (50m) • Field and terrain • Onsite survey • Furniture • Reality check
Time Constraints • Compression of project time line necessitated (1) parallel tasks, and (2) reduced effort for realism. • Focus was given to target site within simulated “loop”. • Emphasis on geometry.
Next Step • Interface proposals generated. • *Collect comments from experts. • Collate and nominate interface candidate. • Simulate candidate. • Design experiment. • Simulate scenario. • *Pilot study. • Conduct study • Analyze and report.