
Uploaded by
acacia
3 SLIDES
176 VIEWS
30LIKES
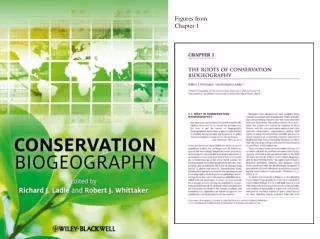
Figures from Chapter 1
DESCRIPTION
Figures from Chapter 1. Figure 1.1 Approximate chronology of the emergence of conservation biogeography, positioning the... from this chronology is the emergence of the concept of biodiversity at the end of the 1980s (see Box 1.1).
Download
1 / 3
Download Presentation 
Figures from Chapter 1
An Image/Link below is provided (as is) to download presentation
Download Policy: Content on the Website is provided to you AS IS for your information and personal use and may not be sold / licensed / shared on other websites without getting consent from its author.
Content is provided to you AS IS for your information and personal use only.
Download presentation by click this link.
While downloading, if for some reason you are not able to download a presentation, the publisher may have deleted the file from their server.
During download, if you can't get a presentation, the file might be deleted by the publisher.
E N D
Presentation Transcript
Figures from Chapter 1
Figure 1.1 Approximate chronology of the emergence of conservation biogeography, positioning the... from this chronology is the emergence of the concept of biodiversity at the end of the 1980s (see Box 1.1).
Figure B1.2a An illustration of Robert Harding Whittaker’s diversity scale framework, showing how each scale of...differentiation diversity concepts. Re-drawn from Stoms and Estes (1993).


More Related
Audio
Live Player