Download
1 / 34
340 likes | 366 Views
Explore models assessing oxidative stress in Alzheimer’s and Amyotrophic Lateral Sclerosis, with examples from human and animal studies. Learn about oxidative damage, biomarkers, and potential treatment approaches.

E N D
Aging and Neurodegenerative Diseases: Models and Assessment of the Impact and Responses to ROS / RNS Kenneth Hensley Free Radical Biology and Aging Research Program Oklahoma Medical Research Foundation
Overview Discussion of Alzheimer’s disease and amyotrophic lateral sclerosis (ALS) Methods for studying oxidative stress with examples From recent human and animal studies What the animal models are beginning to tell us about the relationship of oxidative stress to neuroinflammation
Oxidative Damage in Neurological Disease Implicated in: rodent models: Alzheimer’s disease (AD) Several genetic models e.g. Tg2576, APP/PS1 mice Amyotrophic lateral sclerosis G93A-SOD1, G85R SOD1, (ALS, Lou Gherig’s disease) other SOD1 mice; ALS2 mouse peripherin mouse Huntington’s disease R6/2 mouse, 3-nitropropionate Parkinson’s disease MPTP induced lesions; LPS- induction models Stroke Gerbil, rat models for carotid and MCAO occlusion
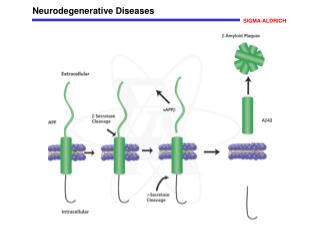
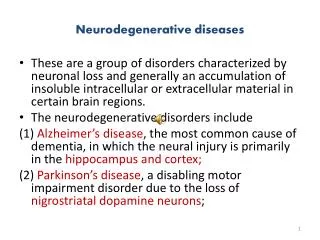
Alzheimer’s Disease Characterized by amyloid protein deposition in plaques and by intraneuronal inclusions of various proteins (eg. hyperphosphorylated tau) Glial activation around plaques, and associated neuron damage / death Region-specific accumulation of oxidative damage that correlates with histopathology
Histopathology of AD: Plaques and Tangles Histochemistry: anti-phospho-p38 / cresyl violet
O H N C H C O H O O 2 O C H H N C H C O H H N C H C O H 2 H N C H C O H 2 2 2 C H C H O H C H 2 2 2 O H O H O H R O H C H 2 R = H tyrosine H O C C H N H 2 o-tyrosine m-tyrosine R = OH 3,4-DOPA O R = Cl 3-chlorotyrosine 3,3-dityrosine R = NO2 3-nitrotyrosine 3,4-DOPA 3-NO2-Tyr Tyr 3,3’-diTyr 3-Cl-Tyr o-Tyr m-Tyr 20 900 mV 830 mV 750 mV 700 mV % methanol 600 mV 350 mV 240 mV 180 mV 0 20 30 40 50 60 70 80 90 retention time (min) Oxidative damage to brain can be measured (sometimes) using HPLC with electrochemical detection
* * * * * * Protein 3-NO2-Tyr is Elevated Region-Selectively in Human AD Brain Hensley et al.,J. Neurosci. 18: 8126-8132 (1998)
Lipid phase nitration: 5-NO2--tocopherol can be detected in AD brain tissue using HPLC-ECD R = CH3a-tocopherol R = H g-tocopherol R = NO2 5-NO2-g-tocopherol gT aT 2 1 0 5-NO2-gT response (nA) 5 10 15 20 25 30 35 40 retention time (minutes)
0.5 * 0.4 0.8 CBL IPL SMTG * 0.4 0.3 0.6 0.3 5-NO2 - g -tocopherol / g - tocopherol 0.2 0.4 0.2 0.1 0.2 0.1 0.0 0.0 0.0 normal AD normal AD normal AD 5-NO2--tocopherol is elevated in the AD brain in a region-selective manner that correlates with 3-NO2-Tyr elevations Williamson et al.,Nitric Oxide: Biol Chem, 6: 221-227 (2002)
Brain protein carbonyl load increases with age and further increases in Alzheimer’s diseased cortex Smith et al.,Proc. Natl. Acad. Sci. USA88: 10540-10543 (1991)
Mouse models of AD partially reproduce the oxidative damage aspect of the disease Lim et al.,J. Neurosci. 21: 8370-8377 (2001)
Oxidative damage in humans and animal models of ALS ALS is a fatal motor neuron disease causing death of neurons in the spinal cord, brainstem and motor cortex. It is essentially untreatable (+6 month life extension with the NMDA receptor antagonist riluzole). Prognosis: Progressive paralysis followed by death in 3-5 years. Death is usually by pneumonia and near complete paralysis.
ALS may be sporadic or familial About 20 % of all ALS cases are heritable Of these, 20-30% are caused by gain-of-toxic Function mutations in Cu,Zn-SOD (SOD1) [Deng et al.Science20: 1047-1051 (1993)] 2O2 •– + 2 H+ H2O2 + O2 SOD1 SOD1 normally detoxifies ROS; it is unclear what is the toxic gain-of-function associated with mutant SOD1.
Cu,Zn-Superoxide Dismutase (SOD1) SOD1 knockout mice are viable; no CNS disease. Human wild-type SOD1 over-expressing mice are healthy Mutant SOD1 causes ALS-like disease in mice when ubiquitously expressed but not when expression is specifically targeted to neurons (Pramatarova et al. 2001; Lino et al. 2002)
Why do mutant SOD1 enzymes cause motor neuron disease? SOD1 mutants have increased peroxidase activity and convert H2O2 to OH (Valentine and Bredesen 1996; Yim et al. 1997) Mutant SOD1 lose metals easily. Metal deficient enzymes promote protein nitration and render neurons susceptible to apoptosis (Crow, Beckman et al. 1997; Estevez et al. 1999) SOD1 mutants aggregate inside neurons, contribute to toxicity (Bruijn et al. 1998)
Alternative Explanations Maybe SOD1 mutants exert their pathogenic effects through non-neuronal cells. astrocytes microglia Neuroinflammation: • ROS, RNS • cytokines • apoptosis initiators • limited involvement of lymphocytes
Transgenic mice expressing the G93A-SOD1 mutation develop ALS-like disease
1 2 0 1 0 0 8 0 rotarod times % of baseline value 6 0 4 0 2 0 0 4 0 6 0 8 0 1 0 0 1 2 0 1 4 0 age (days) G93A-SOD1 mutant mice experience progressive decline in motor function
Protein carbonyl assessment with biotin hydrazide as developed to study protein oxidation in ALS + biotin hydrazide oxidized protein pH 5.5 (MES) 22-24oC, 8 H stable hydrazone derivative, detectable with streptavidin-HRP and standard chemiluminescence reagents Hensley et al.,J. Neurochem. 82: 365-374 (2002)
Protein carbonyl levels are increased in the G93A-SOD1 mouse spinal cord at 120 D Hensley et al.,J. Neurochem. 82: 365-374 (2002) Andrus, Fleck and Gurney J. Neurochem. 71: 2041-2048 (1998)
Where are these ROS coming from? Hypothesis: Activated microglia, dysregulated cytokine networks and the neuroinflammatory process
RPA analysis indicates broad-spectrum elevations of cytokine messages at 120D in G93A-SOD1 mice nonTg G93A-SOD1 IL12p35 IL10 IL1a IL1b IL1RA IL18 IL6 IFNg MIF L32 GAPDH Hensley et al.,J. Neurochem. 82: 365-374 (2002)
TNF and TGF1/2 are also upregulated at 120 D nonTg G93A-SOD1 TNFa IFNg IFNb TGFb1 TGFb2 TGFb3 MIF L32 GAPDH
Glia-activating cytokines are increased in G93A-SOD1 mice in an age-dependent fashion difference at 80 Ddifference at 120 D % of nonTg % of wt-hSOD% of nonTg TNFa 152* 717* TNFRI 164* 333*I IL1a 217* 397* 294* IL1b 178* 760* 183* IL1RA 355* 2085* 415* IFNg 147* IL6 ND 155* ND IL10 133 117 127 IL12-p35 235* 135* 131 IL18 158* 99 107 MIF 116* 73* 89 IL2 ND 90 IL3 ND 99 IL4 ND 123
Cytokines and chemokines are elevated at the protein level in G93A-SOD1 mouse spinal cord pg / mg protein Analyte NonTg G93A-SOD1 % increase TNFa 42 7 65 3* 55 IFNg 1063 96 1500 91* 41 IL6 488 64 740 115* 52 IL1a 0.54 0.10 1.0 0.10* 85 IL1b 120 18 164 26* 37 IL2 456 30 744 38* 63 IL3 6.2 1.2 8.9 1.1* 44 IL4 1.9 0.2 2.3 0.1* 21 IL5 438 92 595 26* 36 IL10 515 71 640 35* 24 IL12p40 4.6 0.5 5.9 0.8* 28 IL12p70 9.4 1.9 13.0 1.6* 38 IL17 2.9 0.22 3.1 0.38 7 KC 5.8 1.1 8.9 1.5* 53 MIP-1a 248 43 323 41* 30 RANTES 17 3 34 6* 100 GM-CSF 1055 54 1113 57 5
Cytokines induce ROS (I): IL1 Treatment of mixed glial cell culture
Cytokines induce ROS (II): TNF treatment of Walker EOC-20 microglia 2 5 2 0 1 5 NO2- (M) at 24 H 1 0 5 0 0 . 0 1 . 3 2 . 5 5 . 0 10 20 TNF (ng/mL)
Conversely: ROS can induce cytokine transcription in glial cell cultures Gabbita et al.,Arch. Biochem. Biophys. 376: 1-13 (2000)
O O FLAP 5-LOX O2 O O H O H O H arachidonic acid 5-HPETE O C O O H L T A 4 LTC4 synthase glutathione LTA4 hydrolase O H O H Cysteinyl leukotrienes LTC4,LTD4,LTE4 C O O H L T B 4 Other sources of ROS in ALS: Arachidonic acid metabolism
5-LOX is upregulated in G93A-SOD1 mouse spinal cord Western: anti-5LOX 80 kDa 80 D (5-fold) nonTg G93A-SOD1 80 kDa 120 D (2-fold) nonTg G93A-SOD1
Summary Oxidative stress occurs in the central nervous system (CNS) during aging and disease Very useful and faithful genetic models exist for SOME aspects of human CNS disease There is a close, perhaps non-dissociable relationship between oxidative stress and dysfunctional cytokine networks The G93A-SOD1 mouse is an especially attractive model system for the study of these issues.
Future directions We need more tools! Animal genetic manipulations: To dissect the biochemistry New bioanalytical technologies : To analyze the problem and assess the models Especially we need attention to the protein chemistry and protein-protein interactions
Acknowledgments Oklahoma Medical Research Foundation Dr. Robert Floyd Shenyun Mou Dr. Brian Gordon Quentin Pye Dr. Paula Grammas Scott Salsman Dr. Ladan Hamdeyhari Dr. Charles Stewart Dr. Molina Mhatre Melinda West Kelly Williamson External Collaborators Dr. Joe Fedynyshyn and Dr. Lindsey Fan, BioRad Laboratories Dr. William Markesbery and Sanders Brown Center on Aging, University of Kentucky, Lexington KY Dr. Flint Beal, Cornell Medical Center Funding support ALS Association National Institute on Aging (R03AG20783-01) Oklahoma Center for Advancement of Science and Technology (HR01-149RS) Oklahoma Center for Neurosciences (OCNS)