Forecasting/ Causal Model
Forecasting/ Causal Model. MGS 8150. Forecasting. Quantitative Forecasting. -- Forecasting based on data and models. Causal Models:. Price Population Advertising …… . Causal Model. Year 2000 Sales. Time Series Models:. Sales 1999 Sales 1998 Sales 1997 …… . Time Series Model.


Forecasting/ Causal Model
E N D
Presentation Transcript
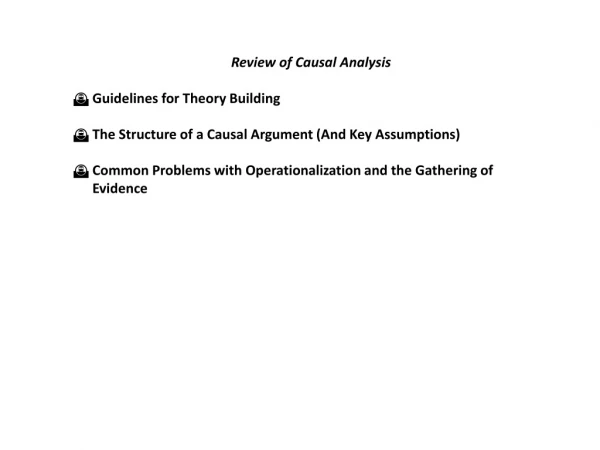
Forecasting/ Causal Model MGS 8150
Quantitative Forecasting --Forecasting based on data and models • Causal Models: Price Population Advertising …… Causal Model Year 2000 Sales • Time Series Models: Sales1999 Sales1998 Sales1997 …… Time Series Model Year 2000 Sales
Causal versus Correlation • There is some confusion between causality and correlation. • All causality has some correlation; but all correlations do not indicate causality.
Causal forecasting • Regression • Find a straight line that fits the data best. • y = Intercept + slope * x • Slope = change in y / change in x Best line! Intercept
Causal Forecasting Models • Curve Fitting: Simple Linear Regression • One Independent Variable (X) is used to predict one Dependent Variable (Y). • Prediction line is written as: Y = a + bX, where a is the Intercept of the line and b is the Coefficient. • a and b are estimated by software (say, Excel). No need to learn formulas for them. Find the regression line with Excel Use Excel’s Data | Data Analysis | Regression (You may need a plug-in Analysis Tool Pack) • Curve Fitting: Multiple Regression • Two or more independent variables are used to predict the dependent variable: Y = b0 + b1X1 + b2X2 + … + bpXp
Using of the Model • Make a forecast or prediction • Interpretation of the coefficients of X (aka, independent variables) • Interpretation of the intercept (optional)
Evaluating Goodness of the Model • Check the following – • Check R-squared (for the whole model). • Indicates how much of the total sum of squared (SS column in the Excel output) is explained away or removed by the Regression model. R-squared = SS Regression/ SS Total. • Higher the better … absolute acceptable values depend on the knowledge level of the field • Check F-value and its significance (for the whole model). • F-value indicates overall goodness of the model. Higher the better. • Check its significance value, simply put, is the probability that the model is not a good fit. Lower the better. • Check p-values (for the individual variables) • P-value of a variable, simply put, is the probability that the variable is not a significant player in the model. Lower the better.