Download

1 / 97
1.09k likes | 1.55k Views
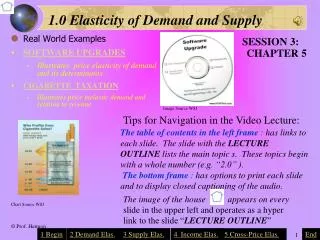
Elasticity of Supply & Demand. PRICE ELASTICITY OF DEMAND. THE LAW OF DEMAND SAYS. Consumers will buy more when prices go down and less when prices go up. HOW MUCH MORE OR LESS?. Price Elasticity Provides an Answer . PRICE ELASTICITY OF DEMAND. Measures Responsiveness to Price Changes.

E N D
Elasticity of Supply & Demand
PRICE ELASTICITY OF DEMAND THE LAW OF DEMAND SAYS... Consumers will buy more when prices go down and less when prices go up HOW MUCH MORE OR LESS? Price Elasticity Provides an Answer
PRICE ELASTICITY OF DEMAND Measures Responsiveness to Price Changes The percentage change in quantity P The percentage change in price .10 .20 P2 P1 Elasticity is .5 D Q Q2 Q1
Q % d % P PRICE ELASTICITY OF DEMAND Commonly Expressed as… The percentage change in quantity P The percentage change in price P2 P1 Elasticity is .5 D Q Q2 Q1
Percentage change in quantity demanded of product X Ed = Percentage change in price of product X Change in quantity demanded of X Ed = Original quantity demanded of X Change in price of X Original price of X PRICE ELASTICITY OF DEMAND The Price-Elasticity Coefficient and Formula Or equivalently… Elimination of the Minus Sign
Elastic from 1 < X < PRICE ELASTICITY OF DEMAND Price Elasticity is... Inelastic 0 < X < 1 Typical of necessities one must have Typical of luxuries one wants Unit elastic when exactly = 1 Quantity change offsets Price change
Elastic Demand .02 .04 .01 = 1 = .5 = 2 Ed = Ed = Ed = .02 .02 .02 Inelastic Demand Unit Elasticity PRICE ELASTICITY OF DEMAND Interpretations of Ed
PRICE ELASTICITY OF DEMAND Extreme Cases Perfectly Inelastic Demand D1 P Ed = 0 0 Q Perfectly Elastic Demand P D2 Ed = Q 0
DETERMINANTS OF PRICE ELASTICITY OF DEMAND • Substitutability • Proportion of Income • Luxuries versus Necessities • Time
Change in quantity Change in price ΔQ ΔP Ed Ed = = AVG Q AVG P Sum of Quantities/2 Sum of prices/2 PRICE ELASTICITY OF DEMAND More Accurate Calculation – The Midpoint Formula
Lemonade Stand You sell 24 glasses for $.50 each. P x Q = Total Revenue (TR) $.50 x 24 = $12 = Total Revenue -$4 = Total Cost $8 = Profit
Total Revenue • Total Revenue (TR): The total dollars received by a firm for selling a product. • AKA Consumer Expenditures
CIRCULAR FLOW MODEL $ COSTS $ INCOMES RESOURCE MARKET RESOURCES INPUTS BUSINESSES HOUSEHOLDS GOODS & SERVICES GOODS & SERVICES PRODUCT MARKET $ REVENUE $ CONSUMPTION
PRICE ELASTICITY & TOTAL REVENUE So is total revenue When prices are low, P TR D Q Quantity Demanded
PRICE ELASTICITY & TOTAL REVENUE Total revenue rises with price to a point... P TR D Q Quantity Demanded
PRICE ELASTICITY & TOTAL REVENUE Total revenue rises with price to a point... then declines P TR D Q Quantity Demanded
PRICE ELASTICITY & TOTAL REVENUE Total revenue rises with price to a point... then declines P TR D Q Quantity Demanded
PRICE ELASTICITY & TOTAL REVENUE Total revenue rises with price to a point... then declines P TR D Q Quantity Demanded
PRICE ELASTICITY & TOTAL REVENUE Total revenue rises with price to a point... then declines P TR Inelastic Demand D Inelastic Demand Q Quantity Demanded
PRICE ELASTICITY & TOTAL REVENUE Total revenue rises with price to a point... then declines P TR Elastic Demand Inelastic Demand D Elastic Demand Inelastic Demand Q Quantity Demanded
PRICE ELASTICITY & TOTAL REVENUE Total revenue rises with price to a point... then declines P TR Unit Elastic Elastic Demand Inelastic Demand D Elastic Demand Inelastic Demand Q Quantity Demanded
TOTAL REVENUE TEST Another way to determine elasticity • P x Q = TR • P and Q move opposite each other • So how do we know what happens to TR? • If P and TR move together demand is inelastic • If Q and TR move together demand is elastic • If TR doesn’t move demand is unit elastic
%ΔQS Es= %ΔP PRICE ELASTICITY OF SUPPLY
PRICE ELASTICITY OF SUPPLY Immediate Market period P An increase in demand without enough time to change supply causes… Sm Po D1 Q Qo
PRICE ELASTICITY OF SUPPLY Immediate Market period P An increase in demand without enough time to change supply causes… an increase in price Sm Pm Po D2 D1 Q Qo
PRICE ELASTICITY OF SUPPLY Short Run P Ss An increase in demand with more elastic supply causes... Po D1 Q Qo
PRICE ELASTICITY OF SUPPLY Short Run P Ss An increase in demand with more elastic supply causes...a smaller increase in price Ps Po D2 D1 Q Qo Qs
PRICE ELASTICITY OF SUPPLY Long Run An increase in demand in the long run allows greater change causing... P SL Po D1 Q Qo
PRICE ELASTICITY OF SUPPLY Long Run An increase in demand in the long run allows greater change causing... P SL PL Even more elastic response - less price increase Po D2 D1 Q QL Qo
%ΔQDX Exy = %ΔPY CROSS PRICE ELASTICITY OF DEMAND Positive Sign Goods are Substitutes Negative Sign Goods are Complementary Zero or Near-Zero Value Goods are Unrelated
%ΔQD Ei = %Δ Income INCOME ELASTICITY OF DEMAND Positive Sign Goods are Normal or Superior Negative Sign Goods are Inferior
PRICE CONTROLS • Enacted when policymakers believe the market price is unfair to buyers or sellers.
CONTROLS ON PRICES • Price Ceiling • A legal maximum on the price at which a good can be sold. • Price Floor • A legal minimum on the price at which a good can be sold.
How Price Ceilings Affect Market Outcomes • Two possibilities: • Not binding (not effective) • Binding (effective)
Supply $4 Price ceiling 3 Equilibrium price Demand 100 Equilibrium quantity A Market with a Price Ceiling (a) A Price Ceiling That Is Not Binding Price of Ice-Cream Cone Quantity of 0 Ice-Cream Cones
Supply Equilibrium price $3 2 Price ceiling Shortage Demand 75 125 Quantity Quantity supplied demanded A Market with a Price Ceiling (b) A Price Ceiling That Is Binding Price of Ice-Cream Cone Quantity of 0 Ice-Cream Cones
How Price Ceilings Affect Market Outcomes • A binding price ceiling creates • A shortage because QD > QS. • Non-price rationing • Long lines • Discrimination
CASE STUDY:Lines at the Gas Pump • In the early 1970s the government placed a price ceiling on gas. • In 1973, OPEC raised the price of crude oil (input for gas).
Supply, S1 1. Initially, the price ceiling is not Price ceiling binding . . . P1 Demand Q1 The Market for Gasoline with a Price Ceiling (a) The Price Ceiling on Gasoline Is Not Binding Price of Gasoline Quantity of 0 Gasoline
S2 2. . . . but when supply falls . . . S1 P2 Price ceiling 3. . . . the price P1 ceiling becomes 4. . . . binding . . . resulting in a Demand shortage. QS QD Q1 The Market for Gasoline with a Price Ceiling (b) The Price Ceiling on Gasoline Is Binding Price of Gasoline Quantity of 0 Gasoline
How Price Floors Affect Market Outcomes • Two possibilities: • Not binding • Binding
Supply Equilibrium price $3 Price floor 2 Demand 100 Equilibrium quantity A Market with a Price Floor (a) A Price Floor That Is Not Binding Price of Ice-Cream Cone Quantity of 0 Ice-Cream Cones
Supply Surplus $4 Price floor 3 Equilibrium price Demand 80 120 Quantity Quantity demanded supplied A Market with a Price Floor (b) A Price Floor That Is Binding Price of Ice-Cream Cone Quantity of 0 Ice-Cream Cones
How Price Floors Affect Market Outcomes • A binding price floor causes . . . • A surplus because QS > QD. • Non-price rationing
CASE STUDY: MINIMUM WAGE • Minimum wage laws dictate the lowest price possible for labor that any employer may pay.
Labor Supply Equilibrium wage Labor demand Equilibrium employment How the Minimum Wage Affects the Labor Market Wage 0 Quantity of Labor
Labor Supply Labor surplus (unemployment) Minimum wage Labor demand Quantity demanded Quantity supplied How the Minimum Wage Affects the Labor Market Wage 0 Quantity of Labor