Download
1 / 33
340 likes | 478 Views
This study explores the sedimentary record as a vital source for understanding past oceanographic processes. By identifying proxies such as sediment chemistry and microfossil assemblages, we can reconstruct spatial distributions and infer paleo-processes. The interplay between physical, chemical, and biological factors illustrates how modern oceanographic processes inform our understanding of ancient environments. The analysis involves multi-variate statistical approaches, emphasizing the role of proxies in tracing nutrient dynamics and reconstructing historical sea-surface temperatures. The findings reveal significant insights into ocean circulation patterns and their changes over geological timescales.

E N D
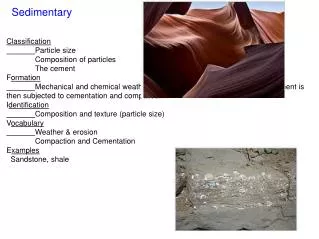
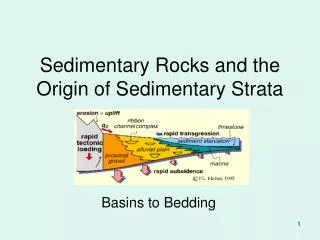
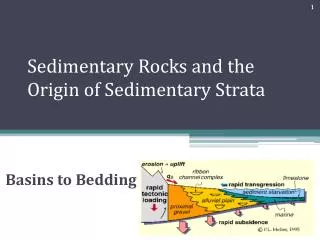
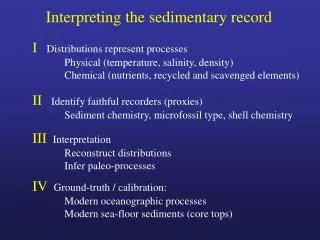
Interpreting the sedimentary record IDistributions represent processes Physical (temperature, salinity, density) Chemical (nutrients, recycled and scavenged elements) IIIdentify faithful recorders (proxies) Sediment chemistry, microfossil type, shell chemistry IIIInterpretation Reconstruct distributions Infer paleo-processes IVGround-truth / calibration: Modern oceanographic processes Modern sea-floor sediments (core tops)
Distributions May reflect more than one process, more than one path. Recorders What do the proxies record? Where? When? (property) (depth habitat) (seasonality) Reconstruction Spatial distribution of paleo data (point, transect, map, 3D) Chronology -- Time slice -- Time series. Interpretation Is the present the key to the past? Distribution ≠ rate
Conservative Invariant with depth. Pacific = Atlantic Recycled Increase downward. Pacific > Atlantic Scavenged Decrease downward. Pacific < Atlantic
Examples: Sea-surface temperature Calcium-carbonate accumulation Deep-ocean circulation
CLIMAP SST Reconstruction of past sea-surface temperatures using statistical (multi- variate) approach to analyzing microfossil assemblages. In this case, planktonic foraminifera shells.
Faunal assemblages Microfossils reflect the predominant planktonic species at a given location. A handful dominate in the tropics.
Faunal assemblages A second assemblage occurs primarily in the subtropics.
Faunal assemblages Another assemblage occupies the subpolar regions.
Faunal assemblages A single species of foraminifera is predominant in polar regions.
Faunal assemblages Observations can be combined to draw inferences about past environments. CLIMAP used a multi-variate statistical approach.
Transfer functions The assemblage data, combined as factors, provide a regression with variables such as SST. Predictions based on these relationships can be tested against other datasets to evaluate the success of the method.
CLIMAP SST Strong cooling at high latitudes and little change in the tropics. Modern LGM
CaCO3 accumulation and evidence for lysocline changes Cores from eastern equatorial Pacific display variations in CaCO3, suggesting repeated shoaling and deepening of dissolution horizon. Core depths
Did the CaCO3 saturation horizon (lysocline) shift at the LGM?
CaCO3 content Higher at LGM in the Pacific. Lower at LGM in other oceans. ATL IND SOU PAC
CaCO3 flux Regional estimates of CaCO3 mass accumulation rates.
CaCO3 flux Global sum = little change. Holocene slightly higher. Does flux = lysocline?
Ocean circulation Evident in many physical properties. Proxies utilize influence of biology. Biological pump Vertical flux of organic matter and hard parts from surface to the deep sea. Superimposed on deep ocean circulation.
The meridional overturning circulation (MOC) produces North Atlantic Deep Water (NADW). NADW GEOSECS Evident in salinity and many other properties…
Biological pump Surface productivity utilizes nutrients and carbon. Gravity moves them to the deep-sea, and respiration returns them to the seawater.
Carbon fluxes Vertical rain of carbon is highest near the surface and declines with depth, Indicating remineralization within the water column. (Data from N. Pacific sediment traps) Martin et al. (1987)
Productivity Biological activity results in systematic changes in concentration and isotopic ratio of bio-limiting and bio-intermediate elements.
Nutrients as tracers Nutrients at depth are swept “downstream” by the global ocean circulation.
SST, density, and nutrients High latitude surface waters in the north are nutrient-depleted. High latitude surface waters in the south are nutrient-rich. Deep-waters formed at the two poles display strong chemical contrast.
Surface water O2 Surface waters (over) saturated due to bubble injection and photosynthesis.
Deep water O2 Deep waters become depleted due to respiration along the circulation pathway.
Deep water O2 Apparent oxygen utilization reveals the pattern of deep ocean circulation.
Carbon isotopes Photosynthetic fractionation of organic carbon leaves seawater enriched in heavier carbon-13. The resulting Isotopic ratio in seawater is then incorporated in CaCO3, providing a nutrient-tracer.
The meridional overturning circulation (MOC) produces North Atlantic Deep Water (NADW). NADW GEOSECS Evident in salinity and many other properties…
The meridional overturning circulation (MOC) produces North Atlantic Deep Water (NADW). NADW Kroopnick (1985) Also evident in carbon isotopes (d13C).
LGM meridional section, western basin Paleocean circulation The configuration was different, but not the rate of circulation? Curry and Oppo (2005)