Download
1 / 1
10 likes | 147 Views
Micro-scale exclusion ( ) reach (Large consumers retained) – see habitat below). S CALE, C ONSUMERS A ND L OTIC E COSYSTEMS R ATES (SCALER). Riffle. Pool. Continent. Background. Study design. Challenges.

E N D
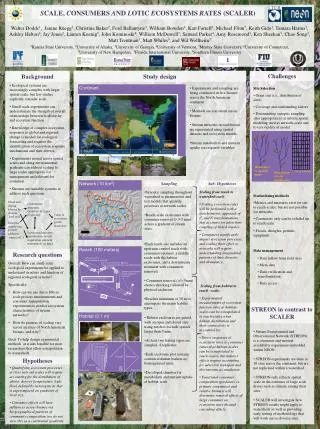
Micro-scale exclusion ( ) reach (Large consumers retained) – see habitat below) SCALE, CONSUMERS AND LOTIC ECOSYSTEMS RATES (SCALER) Riffle Pool Continent Background Study design Challenges • Ecological systems are increasingly complex with larger spatial scale, but few studies explicitly consider scale. • Small-scale experiments can underestimate the strength of overall relationships between biodiversity and ecosytem function. • Knowledge of complex ecosystem responses to global and regional change is needed for ecological forecasting and requires the identification of ecosystem response mechanisms and their drivers. • Experiments nested across spatial scales and along environmental gradients can address scaling to large scales appropriate for management and relevant for evolution. • Streams are tractable systems to address such questions. • Experiments and sampling are being conducted in five biomes across the North American continent. • Methods are consistent across biomes. • Stream networks in each biome are represented using spatial datasets and ecosystem models. • Stream metabolism and nutrient uptake are response variables • Site Selection • Grain size (i.e., distribution of sites) • Coverage and confounding factors • Determinting synoptic sampling sites appropriate to a) inform spatial modeling used as network-scale and b) test validity of model. • Stadardizing methods • Metrics and measures exist for cm- to reach-scales, but are not possible for networks. • Consumers only can be exluded up to reach scale • Floods, droughts, permits, equipment • Data management • Data inflow from field sites • Meta-data • Data verification and transfomration • Data access Walter Dodds1, Janine Rüegg1, Christina Baker2, Ford Ballantyne3, William Bowden4, Kait Farrell3, Michael Flinn5, Keith Gido1, Tamara Harms2, Ashley Helton6, Jay Jones2, Lauren Koenig7, John Kominoski8, William McDowell7, Samuel Parker4, Amy Rosemond3, Ken Sheehan7, Chao Song3, Matt Trentman1, Matt Whiles9, and Wil Wollheim7 1Kansas State University, 2Universtiy of Alaska, 3University of Georgia, 4University of Vermont, 5Murray State University, 6University of Conneticut, 7University of New Hampshire, 8Florida International University, 9Southern Illinois Universtiy Arctic Cariboo Konza Coweeta Luquillo Network (10 km2) Large B Large A Mid B Mid A Small A Small B Sampling Sub- Hypotheses Synoptic sampling Reach exclosure sampling • Scaling from reach to watershed-scale: • Scaling ecosystem rates will be facilitated with a stoichiometric approach of C, and N transformations that accounts for advection-coupling of linked reaches. • Consumers significantly impact ecosystem processes, and scaling their effect to networks will require understanding longitudinal patterns of their diversity and abundance. • Synoptic sampling throughout watershed to parameterize and test models that quantify processes at network scales. • Reach-scale exclosures with consumer removal (> 3-5 mm) across a gradientof stream sizes. Reach (100 meters) Headwaters to quantify input Upstream control (Large consumers retained) Grid overlay Distribution of total benthic area Downstream treatment (Large consumers removed) Flood and drying (driven by climate, land use) Community structure (numbers & types of species) 5mm mesh screen with electric wire along bottom of stream Value of ecosystem goods &services • Each reach-site includes an upstream control reach with consumers retained, a middle reach with the habitat exclosures, and a downstream treatment with consumers removed. • Consumer removal (>3- 5mm) electro-shocking followed by physical exclusion. • Reaches minimum of 30 m to encompass the major habitat types. Resource supply rate (N & P addition, source of C) Flow Research questions Ecosystem functions (production, system respiration, nutrient retention & cycling) Habitat (0.1 m) • Overall: How can small scale ecological experiments be applied to understand structure and function of regional ecological systems? • Specifically: • How can we use dm to 100-m scale process measurements and consumer manipulation experiments to predict ecosystem characteristics of stream networks? • How do patterns of scaling vary across an array of North American biomes, and why? • Goal: To help design experimetal methods at scales feasible for most researchers that allow extrapolation to watersheds. • Scaling from habitat to reach –scale: • Experimental measurements of ecosystem function rates at habitat-scales can be extrapolated to reach-scales when habitat distribution and their connectivity is accounted for. • Direct responses of ecosystem rates to consumer removal at habitat-scales can be extrapolated to reach-scales, but indirect effects require accounting for advective transport and downstream accumulation. • Functional consumer composition (predators vs. primary consumers) and relative biomass will determine removal effects of large consumer on ecosystem rates through cascading effects. Treatment Treatment Control STREON in contrast to SCALER Control FLOW Top view Side view FLOW • Habitat exclosures are paired with an open and closed side using mesh to exclude species larger than 5 mm. • At least two habitat types are sampled, 4 replicates • Each exclosure plot contains contain sediment baskets as homogenized units. • Developed chamber for metabolism and nutrient uptake at habitat-scale • Stream Experimental and Observational Network (STREON) is a consumer and nutrient availability experiment embedded within NEON. • STREON experiments are done at 10 sites across the continent, but are not replicated within a watershed. • STREON only reflects spatial scale in the extremes of large scale divers such as climate among their sites. • SCALER will investigate how STREON results might apply to watersheds as well as providing early testing of methodology that will work across diverse sites. Hypotheses • Quantifying ecosystem processes at river network scales will require accounting for the distribution of abiotic drivers (temperature, light, flow) defined by heterogeneity that is superimposed on gradients of river size. • Consumer effects will have influences across biomes via biogeographical patterns of community composition (we do not view this as a continental gradient).