Irrigation Overview
Irrigation Overview. root zone. water table . Why Irrigate?. Market Drivers. Agricultural exports significant to NZ’s balance sheet Reliable & Quality supply needed to maintain market entry Increasing input costs make production high risk without certainty. root zone.


Irrigation Overview
E N D
Presentation Transcript
root zone water table Why Irrigate?
Market Drivers • Agricultural exports significant to NZ’s balance sheet • Reliable & Quality supply needed to maintain market entry • Increasing input costs make production high risk without certainty
root zone water table Why Irrigate? Irrigation = Tool for Better Risk Management
Economic Benefits of Irrigation Opuha 2004/05 – 16,000ha • Gross Farm Revenue x2.74 ($900 - $2,100/ha) • Farm Expenditure x2.33 ($644 - $1,503/ha) • Cash Farm Surplus x2.74 ($210 - $570/ha) • Employment x2.6 (74 – 192) Whole Community: • $41 million value added per year • 480 FTE’s jobs • Younger & better educated
Economic Benefits of Irrigation NOIC 2009/10 – 10,000ha • Gross Farm Revenue x3.1 ($21million - $65million) • Farm Expenditure x3.1 ($13million - $43million) – most flows to local economy • Cash Farm Surplus x3.1 ($7million - $22million) • Employment x2.1 (71- 147 FTE’s) direct • Farmers spent $62million in conversion – most flows to local economy
Benefits of Irrigation More than $$$’s...... but they are the enabler Prosperity = Opportunity • Social (community) • resilience • quality of service provision • Recreation • New opportunities • improvements to existing • Cultural / Environmental • mitigation • restoration
We Recognise There are Costs Social (community) • direct property loss Recreation • someone’s favourite swim hole / fishing spot Cultural / Environmental • Direct habitat • Indirect impacts – water quality It’s about establishing a ‘framework’ (CWMS targets) and testing options Informing the politics and emotion
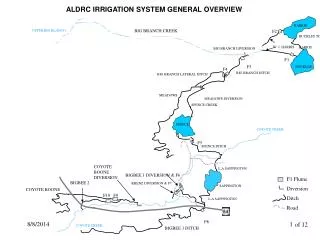
Irrigation System Components • More complex than just use........ • Need to consider - • Supply (take characteristics) • Distribution (how gets to farm) • Use (how applied)
What is Irrigation Efficiency? Many definitions (over 40)……… • Technical (how much used) • Allocative / Economic – Highest value achieved (society) • Dynamic – Adjusting to above over time (flexibility) Within Technical • Production • Hydrological • Profitability • Energy………. But all easier said than done!!!
What are the Main Inefficiencies? Lincoln Environmental Data
Irrigation is Not Uniform Ineffective Inefficient
Solid Set Rotating Boom Fixed Boom Travelling Gun Centre Pivot Linear Move *Multiple sprayline Side Roll Drip Microspray Bubbler Low Head Basin Paddy Basin Border Strip Furrow Modern Furrow 0 20 40 60 80 100 percent efficiency Measured Application Efficiencies Canterbury, Hawke’s Bay & Marlborough From A.J. Clemmens
Irrigation Reliability Reliability = Continuity of Supply Measured by level of drought / security High reliability usually requires a ‘storage’ • Reservoirs / dams • Groundwater
Irrigation Reliability Achieving ‘Good Management Practice’ more complex than on-farm practices Reliability of supply – key driver and an enabler Also Drives Land Use (Risk Management) Pastoral low reliability = OK Alternative easy (import feed / dry-off) Arable & Horticulture = Higher Reliability No or reduced yield
Reliability Creates Environmental Outcomes Water Infrastructure (storage) NOT a reward ........... it’s essential to the Solution Uncertainty = ‘Just in Case’ management but Certainty = ‘Just in Time’ management Optimal water use = Optimal environmental performance Less water per hectare, less storage required and less losses (leaching) = Improved Water Quality
Reliability System Linkages Security and Certainty (Duration of right coupled with sureness of future policy goalposts)) Reliability (Multi-purposewater storage) Crop Diversity & Added Value (Increased range of crops grown & more local processing) Investment - Water Use Efficiency (Efficient distribution and application systems coupled with ‘just in time’ management) Resilient Communities (Diverse local economy & greater prosperity) Reduced Energy (Distribution and application system optimisation) Environmental Performance (Minimise cumulative effects - water use and nutrient losses)
Deliver ‘right amount’ to farm so farmer can deliver the ‘right amount’ at the ‘right time’
Complex/Uncontrollable Complex/Uncontrollable knowledge systems, local governance systems C Public participation, co-management, motivation, ethical/value systems Biophysical and social resilience and capacities - foresee, buffer, adapt, & shape/vision a future; innovative and initiating cultures B Economic instruments, incentivise desired outcome thru ‘rational choice’ market models Scenario analysis; adaptive management; monitoring Simple/Controllable A Regulate effects (set ‘outcome’ standards), monitor, top-down ‘educate’ Regulate activities, monitor & control Certain/Regular/Predictable Increasing Uncertainty/Irregularity Choices in Perspective
What is Audited Self-Management ‘Transfer of day-to-day resource management responsibilities to users, under agreed terms (self management) and subject to an accountability (audit) process’ Much Confusion Around ASM – But we have ventured into the space informally and formally
The Drivers • Harnesses community energy and knowledge • Align regulatory with market compliance and farm management needs • Drives cost efficiencies - market for regulatory & streamlines multiple needs • Decrease regulatory cost to general rate payer • More effective management comes through partnership (compared to top down enforcement) • NZ environment and economy needs optimal resource management……..
INZ Projects • Irrigator User Groups • Days of Individual consent holder numbered • Future = catchment / zonal based management • Prize= better environmental management • ASM for Rakaia-Selwyn • Cost efficiencies • Knowledge systems • Better environmental management • More effective use of available resource
The Future…… 40 years on…… • Precision Resource Information • Linking of Supply & Demand • Real-time Management • Incorporation of Forecasting • (Resource Availability) • Reliable Supply • Efficient Use – Precision Irrigation • Environmental Outcomes Achieved