Download
1 / 31
310 likes | 442 Views
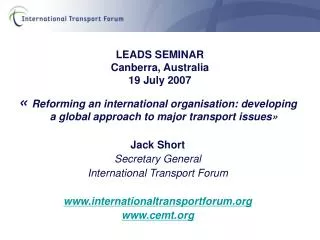
BTRE GUEST SEMINAR Canberra, Australia 19 July 2007. « Recent Road Pricing Experience» Jack Short Secretary General International Transport Forum www.internationaltransportforum.org www.cemt.org. Road Pricing.

E N D
BTRE GUEST SEMINARCanberra, Australia19 July 2007 « Recent Road Pricing Experience» Jack Short Secretary General International Transport Forum www.internationaltransportforum.org www.cemt.org
Road Pricing • Long academic pedigreeDupuit (Fr, 1849), Pigou (UK, 1920), Knight (US, 1924) Walters (UK, 1961), Smeed REport (UK, 1964), Vickery (USA, 1963) • Double consensus • Analysts and academics all for • Politicians against
New Developments • Concrete trials and applications • Schemes different in many ways • Applications • Policy objectives • Economic arguments • Technology used
Stockholm Cordon Charges • 1 to 2 Euros per crossing depending on time of day • Cap on payments per vehicle of 6 Euros per day
-3% -5% -28% -24% -23% -22% -22% -22% -24% Did the Stockholm Charge Work?Vehicles crossing cordon on weekdays: 22% drop in traffic Road pricing trial period
Delays Reduced, Reliability Improved Average trip times compared to free flow & 10% best and worst trip times
Where did cars go? • Half of “evicted” trips for work or school • Half of these moved to public transport • Half discretionary • No switch to public transport, trips were cancelled or combined with other trips
Economic Assessment • Positive • Assuming emissions reductions are added to congestion relief • Assuming bus capacity expansion is not an integral part of scheme, as there was spare capacity • Result is very sensitive to differentiation of values of time assigned to users • Note, technology performed better than expected and 2008 version will reduce costs by eliminating redundancies
Acceptance: Seeing is believingPublic opinion in Stockholm Road pricing trial period
Outcome of Referendum on Trial • Charging will begin long term in Jan 2008 • Stockholm city residents for, region against • Ruling party campaigned against charge but forced to introduce by coalition partners • Stockholm region compensated by revenues earmarked for regional roads
London • Four year study in late 1990’s • Ken Livingston introduced as election pledge in 2003
London Charges Now • 8 pounds a day • 7 pounds for registered fleet vehicles • 90% discount for residents • Exemptions: taxis, buses, two wheelers, alternative fueled vehicles.
Impact on traffic in City zone:delays down 30% Vehicles entering the zone - % change over 2002
Charge relative to cost of congestion • Oxford University Transport Studies Unit, G. Santos, supportsTfL modelling that charge about right but: • Cars over-charged • Trucks under-charged • Vans about right at 8 pounds – undercharged at previous 5 pounds level • Residents “priced on to roads”.
The Economic Costs and Benefits of the London Congestion Charge (2003)
Western Extension • 10-14% veh-km decrease forecast by TfL • 2/3 vehicles pay no additional charge: • Paid already for City zone • Residents • Buses, taxis etc. • Congestion impact and cost effectiveness less than for City zone
First heavy vehicle km charges since 1.1.05 since 1.1.01 since 1.1.04
Switzerland 6-8% Austria 10-12% Germany 20-22% High tariffs make for good cost effectiveness Charge for a 40t lorry 12c/km 27c/km 34c/km 60c/km Operational costsas % of revenue D A CH 2001 CH 2005
Technology • Austria HVF – Transponders, ANPR enforcement, motorways only – few access points so low cost • German Maut – Satellite and mobile phone technology, motorways only but designed to cope with all roads • Swiss HVF – Transponders linked to tachograph for km reading, satellite back up to switch off transponder at border fails, charges on all roads, simple and cheaper than German system
Impact of German Maut on Freight • The number of loaded runs increased by 2% to a total of 82 % • There was an approx. 15% reduction in the number of empty runs • The number of containers carried by rail increased by about 7 %
Dutch Policy • “Rekening rijden I”, km-charge,1988-1990 • “Spitsvignet”, rush-hour charge, 1990-1993 • “Rekening rijden II”, tolling cordons around 4 major cities, 1994-2001 • “Kilometerheffing”, km-charge, 2001-2004 • “Better charging” national km-charge 2005 • Now 2010 for national system
Developed through consensus but with tough conditions • User “platform” recommended charges • To replace fixed vehicle charges • With “fairer” pay-as-you go charge • “Fairness” means a national scheme, that is revenue neutral and identical for all users • Costs must not exceed 5% of revenues
UK Policy • Km charges inevitable - not if, but when and how? • To manage demand • To level charges paid by domestic and foreign trucks (high diesel tax) • To reduce excise tax burden in rural areas • Electronic lorry charge • trialed around Leeds in 2004 for introduction in 2008 • abandoned because expensive compared to paper system • Goal – national electronic km charge for all vehicles • differentiated for congestion • to replace part of fuel excise
US: Value Pricing • Two examples in Southern California: I-15 (near San Diego), SR-91 (connects Riverside and Orange Counties). • Offers a choice: toll and fast travel, or no toll and slow travel (“product differentiation”).
SR-91: tolls vary by time of day and day of week, but not with specific traffic volumes (“static pricing”); • I-15: tolls depend on volumes, to keep traffic smooth (“dynamic pricing”). • SR-91: new lanes, initially private, purchased by public authority to bypass “non-compete clause”; • I-15: existing carpool lanes converted to carpool + toll lanes (“HOT lanes”).
Value pricing is facility pricing (US way), different from cordon pricing (European way). • Attractiveness of toll lanes relies on considerable congestion on free lanes. • Assesments: • Value pricing is better than no pricing, • Gains in reliability as important as reduction of average travel time.
BTRE GUEST SEMINARCanberra, Australia19 July 2007 « Recent Road Pricing Experience» Jack Short Secretary General International Transport Forum www.internationaltransportforum.org www.cemt.org